
Compare Titan Intech with Similar Stocks
Stock DNA
Computers - Software & Consulting
INR 98 Cr (Micro Cap)
17.00
23
0.00%
0.04
3.42%
0.60
Total Returns (Price + Dividend) 
Titan Intech for the last several years.
Risk Adjusted Returns v/s
Returns Beta

News

Titan Intech Ltd Reports Mixed Quarterly Results Amid Shifting Financial Trends
Titan Intech Ltd, a micro-cap player in the Computers - Software & Consulting sector, has reported a mixed quarterly performance for March 2026. While the company’s revenue and profit after tax (PAT) have shown encouraging growth over the last six months, recent quarterly margins and earnings per share (EPS) have contracted sharply, signalling challenges ahead despite an overall positive financial trend.
Read full news article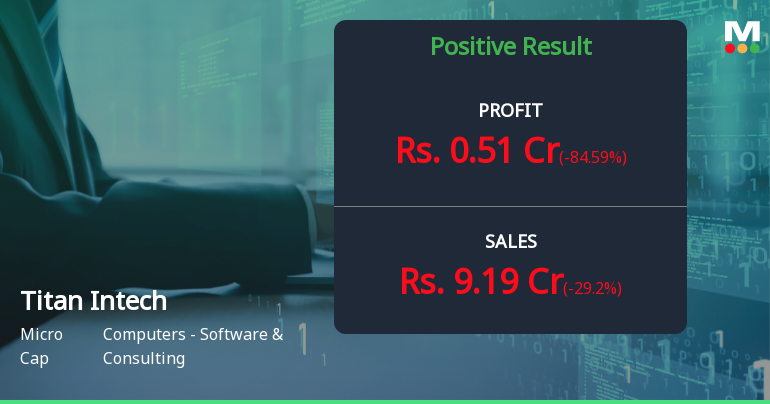
Titan Intech Q4 FY26: Profit Plunge Amid Revenue Volatility Raises Sustainability Concerns
Titan Intech Limited, a micro-cap software and consulting company with a market capitalisation of ₹82.61 crores, reported a sharp decline in quarterly profitability for Q4 FY26, raising questions about earnings sustainability. Net profit plummeted 84.59% quarter-on-quarter to ₹0.51 crores from ₹3.31 crores in Q3 FY26, whilst revenue contracted 29.20% sequentially to ₹9.19 crores. The stock, trading at ₹0.93, has declined 2.11% following the results announcement and remains down 79.56% from its 52-week high of ₹4.55.
Read full news article Announcements
Results: Audited Financial Results For Quarter And Year Ended March 31 2026
30-May-2026 | Source : BSEResults
Board Meeting Outcome for Audited Financial Results For Quarter And Year Ended March 31 2026
30-May-2026 | Source : BSEBoard meeting Outcome
Board Meeting Intimation for Audited Financial Results For Quarter And Year Ended March 31 2026
22-May-2026 | Source : BSETitan Intech Ltdhas informed BSE that the meeting of the Board of Directors of the Company is scheduled on 30/05/2026 inter alia to consider and approve Board meeting intimation
Corporate Actions

No Upcoming Board Meetings

No Dividend history available

Titan Intech Ltd has announced 1:10 stock split, ex-date: 08 Sep 25

Titan Intech Ltd has announced 3:5 bonus issue, ex-date: 17 May 24

Titan Intech Ltd has announced 3:2 rights issue, ex-date: 31 Oct 25
Quality key factors
Valuation key factors
Technicals key factors
 Technical Indicator Scale: Bearish, Mildly Bearish, Sideways, Mildly Bullish, Bullish Turned
 Shareholding Snapshot : Mar 2026
Shareholding Compare (%holding)
Non Institution
None
Held by 0 Schemes
Held by 0 FIIs
Pinnamaneni Estates Private Limited (15.15%)
Satishkumar Hirachand Sheth (2.16%)
77.67%
Quarterly Results Snapshot (Standalone) - Mar'26 - QoQ

QoQ Growth in quarter ended Mar 2026 is -29.20% vs 88.94% in Dec 2025
QoQ Growth in quarter ended Mar 2026 is -84.59% vs 192.92% in Dec 2025
Half Yearly Results Snapshot (Standalone) - Sep'25

Growth in half year ended Sep 2025 is 18.26% vs -45.28% in Sep 2024
Growth in half year ended Sep 2025 is 33.08% vs -34.48% in Sep 2024
Nine Monthly Results Snapshot (Standalone) - Dec'25
YoY Growth in nine months ended Dec 2025 is 16.90% vs -30.52% in Dec 2024
YoY Growth in nine months ended Dec 2025 is 47.25% vs -7.26% in Dec 2024
Annual Results Snapshot (Standalone) - Mar'26
YoY Growth in year ended Mar 2026 is 25.87% vs -38.66% in Mar 2025
YoY Growth in year ended Mar 2026 is 40.55% vs -29.48% in Mar 2025
About Titan Intech Ltd

Company Coordinates


