
Compare Tokyo Electron Ltd. with Similar Stocks
Dashboard
Strong Long Term Fundamental Strength with an average Return on Equity (ROE) of 27.25%
- Healthy long term growth as Net Sales has grown by an annual rate of 16.62% and Operating profit at 24.06%
- Company has very low debt and has enough cash to service the debt requirements
The company has declared Positive results for the last 4 consecutive quarters
With ROE of 29.35%, it has a very attractive valuation with a 5.94 Price to Book Value
Market Beating Performance
Stock DNA
Industrial Manufacturing
JPY 9,545,847 Million (Large Cap)
20.00
NA
0.00%
-0.20
28.42%
5.10
Total Returns (Price + Dividend) 
Tokyo Electron Ltd. for the last several years.
Risk Adjusted Returns v/s
News
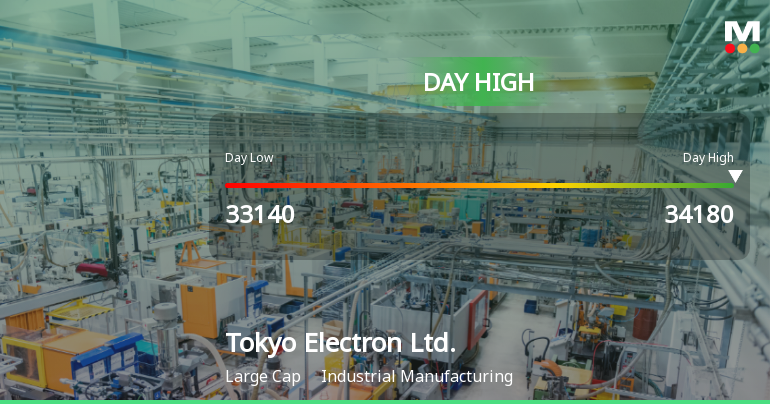
Tokyo Electron Hits Day High with 3.61% Surge, Outperforming Nikkei 225
Tokyo Electron saw a significant rise on October 31, 2025, reaching an intraday high of JPY 34,180.00. The company has shown impressive growth over the past month and year, with strong fundamentals, including a high return on equity and robust net sales growth, indicating a solid market position.
Read full news article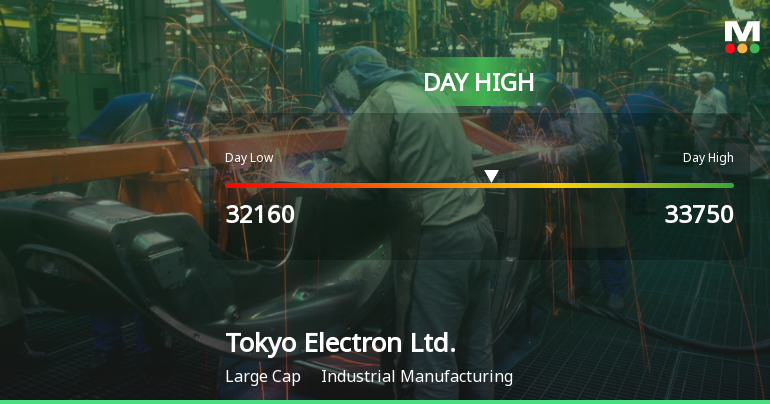
Tokyo Electron Hits Day High with 4.9% Surge, Outperforming Nikkei 225
Tokyo Electron's stock has shown notable performance, gaining 4.9% on October 30, 2025, and reaching an intraday high of JPY 33,750.00. The company has outperformed the Nikkei 225 over various periods, demonstrating strong growth metrics, including a robust return on equity and solid net sales growth.
Read full news article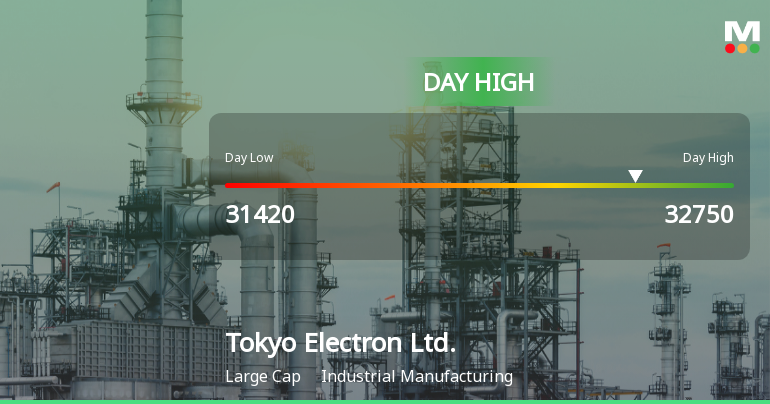
Tokyo Electron Hits Day High with 6.11% Surge Amid Market Decline
Tokyo Electron's stock has shown impressive growth, gaining 6.11% on October 29, 2025, and reaching an intraday high of JPY 32,750.00. The company reported a year-to-date appreciation of 34.34% and strong financial metrics, including a return on equity of 28.42% and significant net sales growth.
Read full news article Announcements

Corporate Actions
Quality key factors
Valuation key factors
Technicals key factors
 Technical Indicator Scale: Bearish, Mildly Bearish, Sideways, Mildly Bullish, Bullish Turned
 Shareholding Snapshot : Mar 2025
Shareholding Compare (%holding)
Foreign Institutions
Held in 0 Schemes (0%)
Held by 4 Foreign Institutions (0.0%)
Quarterly Results Snapshot (Consolidated) - Jun'25 - QoQ

QoQ Growth in quarter ended Jun 2025 is -16.15% vs 0.13% in Mar 2025
QoQ Growth in quarter ended Jun 2025 is -17.60% vs -9.09% in Mar 2025
Annual Results Snapshot (Consolidated) - Mar'25

YoY Growth in year ended Mar 2025 is 32.83% vs -17.13% in Mar 2024
YoY Growth in year ended Mar 2025 is 49.50% vs -22.82% in Mar 2024
About Tokyo Electron Ltd.

Company Coordinates


