
Compare Tokyo Plast Intl with Similar Stocks
Dashboard
Weak Long Term Fundamental Strength with an average Return on Capital Employed (ROCE) of 2.84%
- Poor long term growth as Net Sales has grown by an annual rate of 4.75% over the last 5 years
- Company's ability to service its debt is weak with a poor EBIT to Interest (avg) ratio of 1.41
Flat results in Mar 26
Underperformed the market in the last 1 year
Stock DNA
Diversified consumer products
INR 79 Cr (Micro Cap)
125.00
223
0.00%
0.69
1.00%
1.31
Total Returns (Price + Dividend) 
Latest dividend: 0.5 per share ex-dividend date: Sep-19-2017
Risk Adjusted Returns v/s
Returns Beta

News
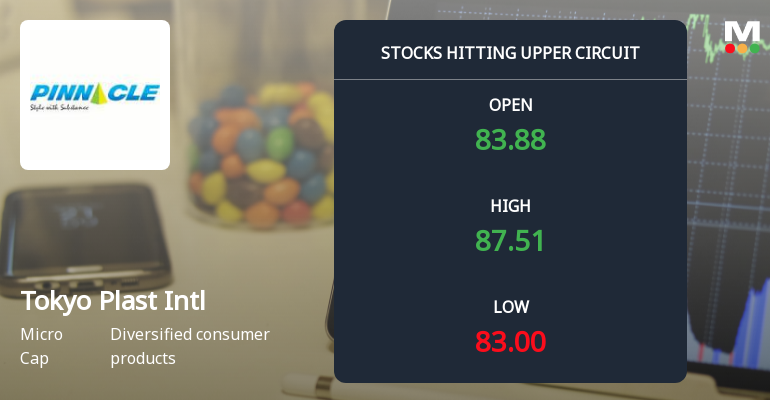
Tokyo Plast International Ltd Locks at Upper Circuit With 5% Gain — Buyers Queue, Sellers Absent
At Rs 88.73, the buying was done — not because demand dried up, but because the exchange wouldn't let the stock go any higher. Tokyo Plast International Ltd locked at its upper circuit of 4.99% on 23 Jun 2026, with buyers queuing and no sellers willing to part with shares.
Read full news article
Tokyo Plast International Ltd is Rated Strong Sell
Tokyo Plast International Ltd is rated Strong Sell by MarketsMOJO. This rating was last updated on 21 January 2026, reflecting a change from the previous 'Sell' grade. However, the analysis and financial metrics discussed here represent the stock's current position as of 17 June 2026, providing investors with the latest insights into its performance and outlook.
Read full news article
Tokyo Plast International Ltd is Rated Strong Sell
Tokyo Plast International Ltd is rated Strong Sell by MarketsMOJO, with this rating last updated on 21 Jan 2026. However, the analysis and financial metrics discussed here reflect the stock’s current position as of 26 May 2026, providing investors with the latest insights into the company’s performance and outlook.
Read full news article Announcements
Compliances-Reg.24(A)-Annual Secretarial Compliance
26-May-2026 | Source : BSEAnnual Secretarial Compliance report for the financial year ended March 31 2026.
Announcement under Regulation 30 (LODR)-Newspaper Publication
22-May-2026 | Source : BSENewspaper publication for Audited Standalone and Consolidated Financial Results for the quarter and Financial year ended March 31 2026
Addendum To Audited Financial Results For The Quarter And Year Ended March 31 2026 - Declaration Under Regulation 33(3)(D)
13-May-2026 | Source : BSESubmission of Declaration under Regulation 33(3)(d) of the SEBI (LODR) Regulations 2015 for the quarter and financial year ended March 31 2026 confirming that the Audit Report issued by Statutory Auditors contains an unmodified opinion.
Corporate Actions

No Upcoming Board Meetings

Tokyo Plast International Ltd has declared 5% dividend, ex-date: 19 Sep 17

No Splits history available

No Bonus history available

No Rights history available
Quality key factors
Valuation key factors
Technicals key factors
 Technical Indicator Scale: Bearish, Mildly Bearish, Sideways, Mildly Bullish, Bullish Turned
 Shareholding Snapshot : Mar 2026
Shareholding Compare (%holding)
Promoters
None
Held by 0 Schemes
Held by 0 FIIs
Dharmil Haresh Shah (27.85%)
Sangeetha S (2.41%)
22.46%
Quarterly Results Snapshot (Consolidated) - Mar'26 - QoQ

QoQ Growth in quarter ended Mar 2026 is 33.49% vs -18.73% in Dec 2025
QoQ Growth in quarter ended Mar 2026 is 130.77% vs -120.31% in Dec 2025
Half Yearly Results Snapshot (Consolidated) - Sep'25
Growth in half year ended Sep 2025 is 8.36% vs -7.90% in Sep 2024

Growth in half year ended Sep 2025 is -6.49% vs 60.42% in Sep 2024
Nine Monthly Results Snapshot (Consolidated) - Dec'25
YoY Growth in nine months ended Dec 2025 is 2.02% vs -0.98% in Dec 2024
YoY Growth in nine months ended Dec 2025 is -30.59% vs 302.38% in Dec 2024
Annual Results Snapshot (Consolidated) - Mar'26
YoY Growth in year ended Mar 2026 is 9.44% vs -4.05% in Mar 2025
YoY Growth in year ended Mar 2026 is -52.27% vs 1,200.00% in Mar 2025
About Tokyo Plast International Ltd

Company Coordinates


