
Compare Tokyo Plast Intl with Similar Stocks
Dashboard
Weak Long Term Fundamental Strength with an average Return on Capital Employed (ROCE) of 2.84%
- Poor long term growth as Net Sales has grown by an annual rate of 4.75% over the last 5 years
- Company's ability to service its debt is weak with a poor EBIT to Interest (avg) ratio of 1.41
Flat results in Mar 26
Below par performance in long term as well as near term
Stock DNA
Diversified consumer products
INR 80 Cr (Micro Cap)
122.00
35
0.00%
0.69
1.00%
1.26
Total Returns (Price + Dividend) 
Latest dividend: 0.5 per share ex-dividend date: Sep-19-2017
Risk Adjusted Returns v/s
Returns Beta

News
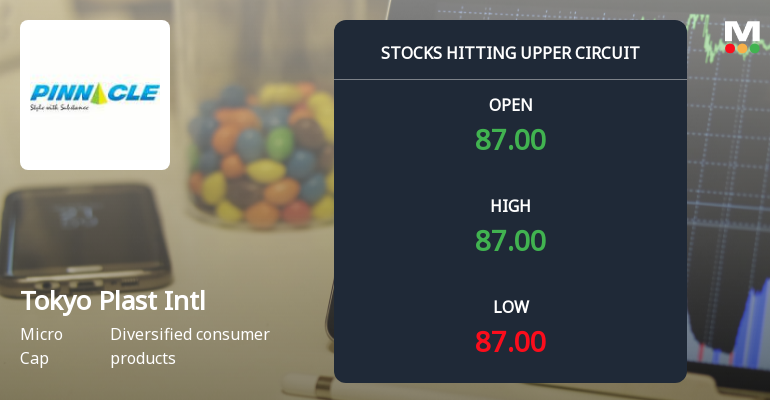
Tokyo Plast International Ltd Locks at Upper Circuit With 5.0% Gain — Buyers Queue, Sellers Absent
At Rs 88.26, the buying was done — not because demand dried up, but because the exchange wouldn't let the stock go any higher. Tokyo Plast International Ltd locked at its upper circuit of 5.0% on 14 Jul 2026, with buyers queuing and no sellers willing to part with shares.
Read full news article
Tokyo Plast International Ltd Locks at Upper Circuit With 5.0% Gain — Buyers Queue, Sellers Absent
At Rs 88.20, the buying was done — not because demand dried up, but because the exchange wouldn't let the stock go any higher. Tokyo Plast International Ltd locked at its upper circuit of 5.0% on 09 Jul 2026, with buyers queuing and no sellers willing to part with shares.
Read full news article
Tokyo Plast International Ltd is Rated Strong Sell
Tokyo Plast International Ltd is rated Strong Sell by MarketsMOJO. This rating was last updated on 21 January 2026, reflecting a change from the previous 'Sell' grade. However, the analysis and financial metrics discussed below are based on the stock's current position as of 09 July 2026, providing investors with an up-to-date view of the company’s fundamentals, returns, and market performance.
Read full news article Announcements
Tokyo Plast International Limited - Outcome of Board Meeting
25-Oct-2019 | Source : NSETokyo Plast International Limited has informed the Exchange regarding Board meeting held on October 24, 2019.
Tokyo Plast International Limited - Trading Window
26-Sep-2019 | Source : NSETokyo Plast International Limited has informed the Exchange regarding the Trading Window closure pursuant to SEBI (Prohibition of Insider Trading) Regulations, 2015
Press Release
12-Sep-2019 | Source : NSE
| Tokyo Plast International Limited has informed the Exchange regarding a press release dated September 08, 2019, titled "Newspaper Advertisements - Notice Of Annual General Meeting Remote E-Voting Information And Book Closure". |
Corporate Actions

No Upcoming Board Meetings

Tokyo Plast International Ltd has declared 5% dividend, ex-date: 19 Sep 17

No Splits history available

No Bonus history available

No Rights history available
Quality key factors
Valuation key factors
Technicals key factors
 Technical Indicator Scale: Bearish, Mildly Bearish, Sideways, Mildly Bullish, Bullish Turned
 Shareholding Snapshot : Mar 2026
Shareholding Compare (%holding)
Promoters
None
Held by 0 Schemes
Held by 0 FIIs
Dharmil Haresh Shah (27.85%)
Sangeetha S (2.41%)
22.46%
Quarterly Results Snapshot (Consolidated) - Mar'26 - QoQ

QoQ Growth in quarter ended Mar 2026 is 33.49% vs -18.73% in Dec 2025
QoQ Growth in quarter ended Mar 2026 is 130.77% vs -120.31% in Dec 2025
Half Yearly Results Snapshot (Consolidated) - Sep'25
Growth in half year ended Sep 2025 is 8.36% vs -7.90% in Sep 2024

Growth in half year ended Sep 2025 is -6.49% vs 60.42% in Sep 2024
Nine Monthly Results Snapshot (Consolidated) - Dec'25
YoY Growth in nine months ended Dec 2025 is 2.02% vs -0.98% in Dec 2024
YoY Growth in nine months ended Dec 2025 is -30.59% vs 302.38% in Dec 2024
Annual Results Snapshot (Consolidated) - Mar'26
YoY Growth in year ended Mar 2026 is 9.44% vs -4.05% in Mar 2025
YoY Growth in year ended Mar 2026 is -52.27% vs 1,200.00% in Mar 2025
About Tokyo Plast International Ltd

Company Coordinates


