
Compare Toray Industries, Inc. with Similar Stocks
Dashboard
High Debt Company with a Debt to Equity ratio (avg) at times
- Poor long term growth as Net Sales has grown by an annual rate of 3.24% and Operating profit at 1.78% over the last 5 years
- High Debt Company with a Debt to Equity ratio (avg) at times
- The company has been able to generate a Return on Equity (avg) of 4.55% signifying low profitability per unit of shareholders funds
Poor long term growth as Net Sales has grown by an annual rate of 3.24% and Operating profit at 1.78% over the last 5 years
With ROCE of 6.13%, it has a attractive valuation with a 0.95 Enterprise value to Capital Employed
Stock DNA
Garments & Apparels
JPY 1,722,631 Million (Large Cap)
18.00
NA
0.00%
0.38
3.90%
1.00
Total Returns (Price + Dividend) 
Toray Industries, Inc. for the last several years.
Risk Adjusted Returns v/s
News
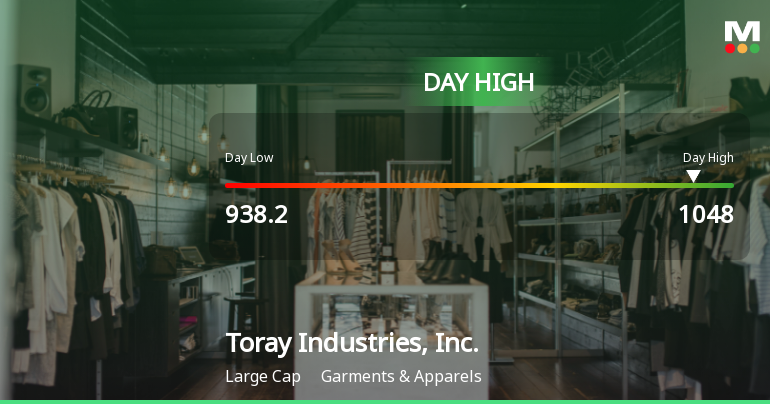
Toray Industries Hits Day High with 9.37% Surge Amid Market Decline
Toray Industries, Inc. has seen a notable increase in its stock price, reaching an intraday high amid a declining market. The company has outperformed the Nikkei 225 over the past week and month, reporting strong financial results, including significant net profit growth and a robust operating cash flow.
Read full news article Announcements

Corporate Actions
Quality key factors
Valuation key factors
Technicals key factors
 Technical Indicator Scale: Bearish, Mildly Bearish, Sideways, Mildly Bullish, Bullish Turned
 Shareholding Snapshot : Sep 2025
Shareholding Compare (%holding)
Foreign Institutions
Held in 0 Schemes (0%)
Held by 2 Foreign Institutions (0.0%)
Quarterly Results Snapshot (Consolidated) - Jun'25 - QoQ

QoQ Growth in quarter ended Jun 2025 is -6.81% vs 1.52% in Mar 2025

QoQ Growth in quarter ended Jun 2025 is 327.63% vs -80.08% in Mar 2025
Annual Results Snapshot (Consolidated) - Mar'25
YoY Growth in year ended Mar 2025 is 4.00% vs -0.99% in Mar 2024
YoY Growth in year ended Mar 2025 is 184.59% vs -62.33% in Mar 2024
About Toray Industries, Inc.

Company Coordinates


