Torrent Pharma

  • Market Cap: Large Cap
  • Industry: Pharmaceuticals & Biotechnology
  • ISIN: INE685A01028
  • NSEID: TORNTPHARM
  • BSEID: 500420
INR
4,985.75
90.75 (1.85%)
BSENSE

Aug 18, 02:12 PM

BSE+NSE Vol: 3.43 lacs

  • Price Points
  • Score
  • Mojo Parameters
  • Total Return
  • News and Corporate Actions
  • Key factors
  • Shareholding
  • Financials
  • CompanyCV
stock-summaryPrice Point
High/Low

1Day

52 Week

Valuation
Technical
Day's Volume

CASH

3.43 lacs (30.14%) Volume

Shareholding (Jul 2026)

FII

17.97%

Held by 885 FIIs

DII

12.87%

Held by 43 DIIs

Promoter

60.78%

Why is Torrent Pharmaceuticals Ltd. falling/rising?

18-Aug-2026

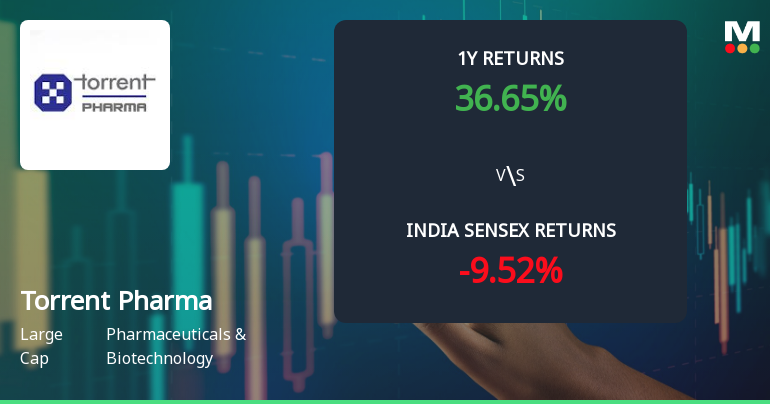
As of 17-Aug, Torrent Pharmaceuticals Ltd. is seeing a stock price increase to 4,895.00, following a trend reversal after two days of decline. The stock has outperformed its sector and has shown strong returns over the past year, supported by efficient management and a favorable debt servicing capability.

As of 17-Aug, Torrent Pharmaceuticals Ltd. is experiencing a rise in its stock price, currently at 4,895.00, with an increase of 54.7 points or 1.13%. This upward movement follows a trend reversal, as the stock has gained after two consecutive days of decline. Additionally, the stock has outperformed its sector by 1.43% today, indicating a positive performance relative to its peers.<BR><BR>Looking at the broader context, Torrent Pharmaceuticals has shown strong returns over various periods, including a year-to-date increase of 27.42% and a remarkable 35.14% rise over the past year. This consistent performance has allowed the stock to outperform the BSE500 index in each of the last three annual periods. Furthermore, the company demonstrates high management efficiency, reflected in a return on capital employed (ROCE) of 21.88%, and a strong ability to service debt, as indicated by a low Debt to EBITDA ratio of 3.30 times.<BR><BR>Despite a recent decline in investor participation, with delivery volume falling by 68.83% compared to the 5-day average, the stock remains liquid enough for trading, supporting its current price movement. Overall, the combination of strong historical performance, efficient management, and a recent trend reversal contributes to the rising stock price of Torrent Pharmaceuticals Ltd.

View full answer

Who are in the management team of Torrent Pharma?

14-Aug-2026

The management team of Torrent Pharma includes Sudhir Mehta (Chairman Emeritus), Samir Mehta (Executive Chairman), and several independent directors such as Shailesh Haribhakti and Ameera Shah, along with operational and compliance leaders like Jinesh Shah and Chintan Trivedi. This diverse team provides strong leadership and expertise to the company.

The management team of Torrent Pharma includes the following key members:<BR><BR>1. **Sudhir Mehta** - Chairman Emeritus<BR>2. **Samir Mehta** - Executive Chairman<BR>3. **Shailesh Haribhakti** - Independent Director<BR>4. **H Khaitan** - Independent Director<BR>5. **Ameera Shah** - Independent Director<BR>6. **Nayantara Bali** - Independent Director<BR>7. **Jinesh Shah** - Director (Operation)<BR>8. **Maurice Chagnaud** - Independent Director<BR>9. **Aman Mehta** - Whole Time Director<BR>10. **Manish Choksi** - Independent Director<BR>11. **Chintan Trivedi** - Company Secretary & Compliance Officer<BR><BR>This team brings a diverse range of expertise and leadership to the company.

View full answer

What does Torrent Pharma do?

14-Aug-2026

Torrent Pharmaceuticals Ltd. is a major Indian pharmaceutical company established in 1959, specializing in chronic and sub-chronic therapeutic segments. As of June 2026, it reported net sales of ₹4,921 Cr and a net profit of ₹566 Cr, with a market cap of ₹185,140 Cr.

Overview:<BR>Torrent Pharmaceuticals Ltd. is a leading player in the Indian pharmaceutical sector, focusing on chronic and sub-chronic therapeutic segments within the Pharmaceuticals & Biotechnology industry and categorized as a Large Cap company.<BR><BR>History:<BR>Torrent Pharmaceuticals Ltd. was incorporated in the year 1959. The latest quarterly results reported are for June 2026, showcasing the company's ongoing performance in the market.<BR><BR>Financial Snapshot:<BR>- Net Sales: 4,921 Cr (Quarterly Results - Jun 2026)<BR>- Net Profit: 566 Cr (Quarterly Results - Jun 2026)<BR>- Market Cap: INR 185,140 Cr (Large Cap)<BR><BR>Key Metrics:<BR>- P/E: 83.00<BR>- Industry P/E: 37<BR>- Dividend Yield: 0.69%<BR>- Debt Equity: 1.55<BR>- Return on Equity: 26.24%<BR>- Price to Book: 22.17<BR><BR>Contact Details:<BR>Address: Torrent House, Off Ashram Road Ahmedabad Gujarat : 380009<BR>Tel: 91-79-26599000<BR>Email: investorservices@torrentpharma.com<BR>Website: http://www.torrentpharma.com

View full answer

Who are the peers of the Torrent Pharma?

14-Aug-2026

Torrent Pharma's peers include Sun Pharma, Divi's Lab, Cipla, Zydus Lifesciences, Lupin, Mankind Pharma, Laurus Labs, Dr Reddy's Labs, Aurobindo Pharma, and Biocon. In terms of growth and returns, Torrent Pharma has average growth and a 1-year return of 34.78%, while Divi's Lab leads with a 39.27% return.

Peers: The peers of Torrent Pharma are Sun Pharma.Inds., Divi's Lab., Cipla, Zydus Lifesci., Lupin, Mankind Pharma, Laurus Labs, Dr Reddy's Labs, Aurobindo Pharma, and Biocon.<BR><BR>Quality Snapshot: Excellent management risk is observed at Sun Pharma.Inds., Divi's Lab., Zydus Lifesci., Lupin, Mankind Pharma, and the rest. Below Average growth is found at Divi's Lab., Cipla, Laurus Labs, Aurobindo Pharma, and the rest. Torrent Pharma has Average growth, while Good growth is noted at Mankind Pharma, Lupin, and the rest. Excellent capital structure is seen at Sun Pharma.Inds., Divi's Lab., Cipla, Zydus Lifesci., Mankind Pharma, Aurobindo Pharma, and the rest, while Torrent Pharma has Good capital structure.<BR><BR>Return Snapshot: The peer with the highest 1-year return is Divi's Lab. at 39.27%, while the lowest is Cipla at -6.46%. Torrent Pharma's 1-year return is 34.78%, which is significantly higher than Cipla's but lower than Divi's Lab. Additionally, Dr Reddy's Labs and Laurus Labs have negative six-month returns.

View full answer

How big is Torrent Pharma?

14-Aug-2026

As of 14th August, Torrent Pharmaceuticals Ltd. has a market capitalization of 184,461.29 Cr, with recent net sales of 15,723.00 Cr and a net profit of 2,156.00 Cr over the last four quarters.

As of 14th August, <BR><BR>Market Cap: Torrent Pharmaceuticals Ltd. has a market capitalization of 184,461.29 Cr, categorizing it as a Large Cap company.<BR><BR>Recent Quarterly Performance: The sum of Net Sales for the latest 4 quarters is 15,723.00 Cr, while the sum of Net Profit for the same period is 2,156.00 Cr.<BR><BR>Balance Sheet Snapshot: The reporting period for the balance sheet is March 2026. Shareholder's Funds are valued at 8,388.43 Cr, and Total Assets amount to 43,613.69 Cr.

View full answer

Are Torrent Pharmaceuticals Ltd. latest results good or bad?

31-Jul-2026

Torrent Pharmaceuticals Ltd.'s latest Q1 FY27 results show strong net sales growth of 54.85% year-on-year, reaching ₹4,921 crores, but net profit only increased by 3.28% due to rising interest costs and depreciation, indicating a need for careful monitoring of profitability despite robust revenue performance.

Torrent Pharmaceuticals Ltd.'s latest results for Q1 FY27 present a mixed picture. On one hand, the company achieved impressive net sales of ₹4,921 crores, reflecting a remarkable year-on-year growth of 54.85% and a sequential increase of 17.25%. This growth is attributed largely to recent acquisitions, which have significantly boosted revenue.<BR><BR>However, the net profit growth was less impressive, with a modest increase of 3.28% year-on-year, rising to ₹566 crores. While this represents a substantial sequential improvement of 55.49% from the previous quarter, it highlights a disconnect between revenue and profit growth. The increase in net profit has been constrained by soaring interest costs, which surged by over 444% to ₹305 crores, and a significant rise in depreciation charges due to the recent acquisitions.<BR><BR>The operating margin improved to 34.42%, indicating effective cost management, but the profit after tax (PAT) margin contracted to 11.71%, down from 17.52% in the same quarter last year, reflecting the impact of increased financial charges.<BR><BR>Overall, while the top-line growth is strong and indicates robust operational performance, the bottom-line growth is concerning due to rising costs and debt levels. This situation suggests that while the company's revenue trajectory is promising, the financial health and profitability metrics warrant careful monitoring.

View full answer

Should I buy, sell or hold Torrent Pharmaceuticals Ltd.?

31-Jul-2026

When is the next results date for Torrent Pharmaceuticals Ltd.?

17-Jul-2026

The next results date for Torrent Pharmaceuticals Ltd. is July 30, 2026.

The next results date for Torrent Pharmaceuticals Ltd. is scheduled for July 30, 2026.

View full answer

Is Torrent Pharma technically bullish or bearish?

02-Dec-2025

As of December 1, 2025, the market trend is mildly bullish, supported by daily moving averages and weekly MACD, but tempered by mildly bearish monthly indicators and market indecision.

As of 1 December 2025, the technical trend has changed from bullish to mildly bullish. The current stance is mildly bullish, driven primarily by the daily moving averages indicating bullish momentum and the weekly MACD also showing a bullish signal. However, the monthly MACD and KST are mildly bearish, suggesting some caution. Bollinger Bands are bullish on both weekly and monthly time frames, supporting the overall positive outlook. The lack of clear trends in Dow Theory and OBV indicates some indecision in the market. Overall, while there are bullish indicators, the presence of mildly bearish signals suggests a tempered bullish sentiment.

View full answer

How has been the historical performance of Torrent Pharma?

01-Dec-2025

Torrent Pharma has shown consistent growth in net sales and profits, with net sales increasing from INR 7,673 crore in March 2019 to INR 11,516 crore in March 2025, and profit after tax rising from INR 436 crore to INR 1,911 crore during the same period. The company also improved its operating profit margin to 32.88% and maintained a solid balance sheet.

Answer:<BR>The historical performance of Torrent Pharma shows a consistent growth trajectory in net sales and profits over the years.<BR><BR>Breakdown:<BR>Torrent Pharma's net sales have steadily increased from INR 7,673.00 crore in March 2019 to INR 11,516.00 crore in March 2025. The total operating income followed a similar trend, rising from INR 7,673.00 crore in March 2019 to INR 11,516.00 crore in March 2025. The company's operating profit (PBDIT) also saw growth, climbing from INR 2,041.00 crore in March 2019 to INR 3,744.00 crore in March 2025, reflecting an improving operating profit margin that reached 32.88% in March 2025. Profit before tax increased from INR 562.00 crore in March 2019 to INR 2,673.00 crore in March 2025, while profit after tax rose from INR 436.00 crore to INR 1,911.00 crore during the same period, resulting in a PAT margin of 16.89% in March 2025. On the balance sheet, total assets increased from INR 13,576.53 crore in March 2020 to INR 14,395.59 crore in March 2025, while total liabilities decreased from INR 14,505.45 crore in March 2024 to INR 14,395.59 crore in March 2025. The cash flow from operating activities showed a positive trend, reaching INR 2,585.00 crore in March 2025, although the net cash flow reflected an outflow of INR 261.00 crore in the same year. Overall, Torrent Pharma has demonstrated strong growth in revenue and profitability, alongside a solid balance sheet position.

View full answer

Who are the top shareholders of the Torrent Pharma?

17-Jul-2025

The top shareholders of Torrent Pharma include Torrent Investments Limited with 68.31%, followed by institutional investors such as mutual funds at 5.03% and foreign institutional investors at 16.31%. The highest public shareholder is NPS Trust at 1.8%, while individual investors hold 4.51% of the shares, with no pledged promoter holdings reported.

The top shareholders of Torrent Pharma are primarily the promoters, with Torrent Investments Limited holding the largest share at 68.31%. Additionally, institutional investors play a significant role, with 38 mutual funds collectively holding 5.03% and 819 foreign institutional investors (FIIs) holding 16.31%. The highest public shareholder is NPS Trust, which holds 1.8%, while individual investors account for 4.51% of the shares. There are no pledged promoter holdings reported.

View full answer

Is Torrent Pharma overvalued or undervalued?

09-Jun-2025

As of January 12, 2024, Torrent Pharma is considered very expensive and overvalued, with a PE Ratio of 55.29 and an EV to EBITDA of 29.34, significantly higher than its peers like Sun Pharma and Cipla, despite a strong historical performance.

As of 12 January 2024, Torrent Pharma's valuation grade has moved from expensive to very expensive, indicating a significant shift in its market positioning. The company is currently considered overvalued. Key ratios include a PE Ratio of 55.29, an EV to EBITDA of 29.34, and a PEG Ratio of 2.63, all of which are substantially higher than industry norms.<BR><BR>In comparison to its peers, Torrent Pharma's valuation metrics stand out unfavorably; for instance, Sun Pharma has a PE Ratio of 35.25 and an EV to EBITDA of 24.91, while Cipla boasts a more attractive PE of 22.99 and an EV to EBITDA of 15.93. The elevated ratios suggest that Torrent Pharma is priced at a premium compared to its competitors, reinforcing the conclusion of overvaluation. Despite a strong historical performance, including a 10.86% return over the past year compared to the Sensex's 7.65%, the current valuation does not align with its financial fundamentals.

View full answer

What is the bonus history of the Torrent Pharma?

06-Jun-2025

Torrent Pharmaceuticals has issued bonuses to shareholders, with the most recent being a 1:1 bonus on July 8, 2022, and a previous 1:1 bonus on July 23, 2013. This practice demonstrates the company's commitment to rewarding its shareholders.

Torrent Pharmaceuticals has a history of issuing bonuses to its shareholders. The most recent bonus was a 1:1 bonus issue, which was announced with an ex-date of July 8, 2022, and a record date of July 11, 2022. Prior to that, the company also issued a 1:1 bonus on July 23, 2013, with a record date of July 24, 2013. This consistent practice of bonus issues reflects the company's commitment to rewarding its shareholders.

View full answer

Has Torrent Pharma declared dividend?

06-Jun-2025

Yes, Torrent Pharmaceuticals Ltd. has declared a 520% dividend, amounting to ₹26 per share, with an ex-date of January 31, 2025. The company has shown strong total returns over various periods, particularly in the long term.

Torrent Pharmaceuticals Ltd. has declared a 520% dividend.<BR><BR>Dividend Details:<BR>- Percentage announced: 520%<BR>- Amount per share: 26 per share<BR>- Ex-date: 31 Jan 25<BR><BR>Dividend Yield: 1.02%.<BR><BR>Total Returns by Period:<BR>In the 6-month period, the price return was -5.18%, the dividend return was 0.78%, resulting in a total return of -4.4%.<BR><BR>For the 1-year period, the price return was 13.48%, the dividend return was 1.12%, leading to a total return of 14.6%.<BR><BR>Over the 2-year period, the price return was 76.44%, the dividend return was 3.34%, culminating in a total return of 79.78%.<BR><BR>In the 3-year period, the price return was 127.44%, the dividend return was 5.39%, resulting in a total return of 132.83%.<BR><BR>For the 4-year period, the price return was 124.57%, the dividend return was 7.42%, leading to a total return of 131.99%.<BR><BR>In the 5-year period, the price return was 166.6%, the dividend return was 12.25%, culminating in a total return of 178.85%.<BR><BR>Overall, Torrent Pharmaceuticals has declared a substantial dividend, and the total returns over various periods indicate strong performance, particularly in the longer term, suggesting a positive outlook for investors.

View full answer
iScoreScore
Click here to find our call on this stock
Strong Sell
Sell
Hold
Buy
Strong Buy

Dashboard

1

High Management Efficiency with a high ROCE of 21.88%

 
2

Strong ability to service debt as the company has a low Debt to EBITDA ratio of 3.30 times

 
3

Flat results in Jun 26

4

With ROCE of 16.1, it has a Very Expensive valuation with a 9.3 Enterprise value to Capital Employed

5

Consistent Returns over the last 3 years

stock-summaryMojo Parameters

Mojo Parameters

Loading Valuation Snapshot...

Stock DNA

stock-summary
Industry

Pharmaceuticals & Biotechnology

stock-summary
Market cap

INR 189,642 Cr (Large Cap)

stock-summary
P/E

83.00

stock-summary
Industry P/E

37

stock-summary
Dividend Yield

0.69%

stock-summary
Debt Equity

1.55

stock-summary
Return on Equity

26.24%

stock-summary
Price to Book

22.19

Revenue and Profits:
Net Sales:
4,921 Cr
(Quarterly Results - Jun 2026)
Net Profit:
566 Cr
stock-summaryTotal Returns
Total Returns (Price + Dividend) stock-summary
Dividend Yield (0.69%)
TimePeriod
Price Return
Dividend Return
Total Return
3 Months
13.45%
0.20%
13.65%
6 Months
18.43%
0.21%
18.64%
1 Year
36.48%
1.04%
37.52%
2 Years
48.99%
1.87%
50.86%
3 Years
151.85%
5.03%
156.88%
4 Years
219.55%
7.54%
227.09%
5 Years
226.57%
8.35%
234.92%

Latest dividend: 9 per share ex-dividend date: May-29-2026

Risk Adjusted Returns v/s stock-summary
Returns Beta
Icon
Beta has not been calculated since enough price history is not available
stock-summaryNews & Corporate Actions

News

Torrent Pharmaceuticals Falls 2.96%: 2 Key Events Shaping the Week

Announcements stock-summary

Intimation Under Regulation 30 Of SEBI (Listing Obligations And Disclosure Requirements) Regulations 2015 - ESG Rating

11-Aug-2026 | Source : BSE

ESG Rating

Announcement under Regulation 30 (LODR)-Analyst / Investor Meet - Intimation

11-Aug-2026 | Source : BSE

Intimation of Schedule of Investors Meet under Regulation 30 of SEBI (Listing Obligations and Disclosure Requirements) Regulations 2015

Announcement under Regulation 30 (LODR)-Newspaper Publication

06-Aug-2026 | Source : BSE

Newspaper Advertisement for completion of dispatch of Postal Ballot Notice

Corporate Actions stock-summary

stock-summary
BOARD MEETING

No Upcoming Board Meetings

stock-summary
DIVIDEND

Torrent Pharmaceuticals Ltd. has declared 180% dividend, ex-date: 29 May 26

stock-summary
SPLITS

Torrent Pharmaceuticals Ltd. has announced 5:10 stock split, ex-date: 20 Feb 06

stock-summary
BONUS

Torrent Pharmaceuticals Ltd. has announced 1:1 bonus issue, ex-date: 08 Jul 22

stock-summary
RIGHTS

No Rights history available

stock-summaryKey Factors

Quality key factors stock-summary

Factor
Value
Sales Growth (5y)
14.23%
EBIT Growth (5y)
14.88%
EBIT to Interest (avg)
8.04
Debt to EBITDA (avg)
1.53
Net Debt to Equity (avg)
1.55
Sales to Capital Employed (avg)
0.90
Tax Ratio
24.80%
Dividend Payout Ratio
59.45%
Pledged Shares
0
Institutional Holding
30.84%
ROCE (avg)
22.98%
ROE (avg)
23.24%

Valuation key factors

Factor
Value
P/E Ratio
83
Industry P/E
37
Price to Book Value
22.19
EV to EBIT
54.13
EV to EBITDA
38.37
EV to Capital Employed
9.32
EV to Sales
12.67
PEG Ratio
NA
Dividend Yield
0.69%
ROCE (Latest)
16.09%
ROE (Latest)
26.24%

Technicals key factors

Indicator
Weekly
Monthly
MACD
Bullish
Bullish
RSI
No Signal
No Signal
Bollinger Bands
Bullish
Mildly Bullish
Moving Averages
Bullish (Daily)
KST
Bullish
Bullish
Dow Theory
Mildly Bearish
Bullish
OBV
No Trend
Bullish
stock-summary Technical Indicator Scale: Bearish, Mildly Bearish, Sideways, Mildly Bullish, Bullish  Turned 
stock-summaryShareholding
Shareholding Snapshot : Jul 2026stock-summary
Shareholding Compare (%holding) stock-summary
Majority shareholders

Promoters

Pledged Promoter Holdings

None

Mutual Funds

Held by 44 Schemes (8.27%)

FIIs

Held by 885 FIIs (17.97%)

Promoter with highest holding

Torrent Investments Limited (formerly Known As Torrent Investments Private Limited) (60.78%)

Highest Public shareholder

Nps Trust (2.23%)

Individual Investors Holdings

6.82%

stock-summaryFinancial
[
  {
    "link": "quarterly",
    "btn_text": "All Quarterly Results",
    "header": "Quarterly Results Snapshot (Consolidated) - Jun'26 - QoQ",
    "rhs": [
      {
        "prefix": "Net Sales ",
        "suffix": "QoQ Growth in quarter ended Jun 2026 is 17.25% vs 27.07% in Mar 2026",
        "dir": -1
      },
      {
        "prefix": "Consolidated Net Profit ",
        "suffix": "QoQ Growth in quarter ended Jun 2026 is 55.49% vs -42.68% in Mar 2026",
        "dir": 1
      }
    ],
    "table": {
      "header": [
        "Jun'26",
        "Mar'26",
        "Change(%)"
      ],
      "body": [
        {
          "field": "Net Sales",
          "val1": "4,921.00",
          "val2": "4,197.00",
          "chgp": "17.25%",
          "chgp_class": "positive"
        },
        {
          "field": "Operating Profit (PBDIT) excl Other Income",
          "val1": "1,664.00",
          "val2": "1,356.00",
          "chgp": "22.71%",
          "chgp_class": "positive"
        },
        {
          "field": "Interest",
          "val1": "305.00",
          "val2": "236.00",
          "chgp": "29.24%",
          "chgp_class": "negative"
        },
        {
          "field": "Exceptional Items",
          "val1": "-21.00",
          "val2": "-66.00",
          "chgp": "68.18%",
          "chgp_class": "positive"
        },
        {
          "field": "Consolidate Net Profit",
          "val1": "566.00",
          "val2": "364.00",
          "chgp": "55.49%",
          "chgp_class": "positive"
        },
        {
          "field": "Operating Profit Margin (Excl OI)",
          "val1": "34.42%",
          "val2": "32.85%",
          "chgp": "1.57%",
          "chgp_class": "positive"
        }
      ]
    }
  },
  {
    "link": "half-yearly",
    "btn_text": "All Half Yearly Results",
    "header": "Half Yearly Results Snapshot (Consolidated) - Sep'25",
    "rhs": [
      {
        "prefix": "Net Sales ",
        "suffix": " Growth in half year ended Sep 2025 is 12.73% vs 9.46% in Sep 2024",
        "dir": 1
      },
      {
        "prefix": "Consolidated Net Profit ",
        "suffix": " Growth in half year ended Sep 2025 is 25.16% vs 19.11% in Sep 2024",
        "dir": 1
      }
    ],
    "table": {
      "header": [
        "Sep'25",
        "Sep'24",
        "Change(%)"
      ],
      "body": [
        {
          "field": "Net Sales",
          "val1": "6,480.00",
          "val2": "5,748.00",
          "chgp": "12.73%",
          "chgp_class": "positive"
        },
        {
          "field": "Operating Profit (PBDIT) excl Other Income",
          "val1": "2,115.00",
          "val2": "1,843.00",
          "chgp": "14.76%",
          "chgp_class": "positive"
        },
        {
          "field": "Interest",
          "val1": "104.00",
          "val2": "139.00",
          "chgp": "-25.18%",
          "chgp_class": "positive"
        },
        {
          "field": "Exceptional Items",
          "val1": "-13.00",
          "val2": "0.00",
          "chgp": "",
          "chgp_class": "neutral"
        },
        {
          "field": "Consolidate Net Profit",
          "val1": "1,139.00",
          "val2": "910.00",
          "chgp": "25.16%",
          "chgp_class": "positive"
        },
        {
          "field": "Operating Profit Margin (Excl OI)",
          "val1": "33.18%",
          "val2": "32.64%",
          "chgp": "0.54%",
          "chgp_class": "positive"
        }
      ]
    }
  },
  {
    "link": "nine-monthly",
    "btn_text": "All Nine Monthly Results",
    "header": "Nine Monthly Results Snapshot (Consolidated) - Dec'25",
    "rhs": [
      {
        "prefix": "Net Sales ",
        "suffix": "YoY Growth in nine months ended Dec 2025 is 14.33% vs 7.19% in Dec 2024",
        "dir": 1
      },
      {
        "prefix": "Consolidated Net Profit ",
        "suffix": "YoY Growth in nine months ended Dec 2025 is 25.55% vs 17.07% in Dec 2024",
        "dir": 1
      }
    ],
    "table": {
      "header": [
        "Dec'25",
        "Dec'24",
        "Change(%)"
      ],
      "body": [
        {
          "field": "Net Sales",
          "val1": "9,783.00",
          "val2": "8,557.00",
          "chgp": "14.33%",
          "chgp_class": "positive"
        },
        {
          "field": "Operating Profit (PBDIT) excl Other Income",
          "val1": "3,203.00",
          "val2": "2,757.00",
          "chgp": "16.18%",
          "chgp_class": "positive"
        },
        {
          "field": "Interest",
          "val1": "149.00",
          "val2": "196.00",
          "chgp": "-23.98%",
          "chgp_class": "positive"
        },
        {
          "field": "Exceptional Items",
          "val1": "-23.00",
          "val2": "0.00",
          "chgp": "",
          "chgp_class": "neutral"
        },
        {
          "field": "Consolidate Net Profit",
          "val1": "1,774.00",
          "val2": "1,413.00",
          "chgp": "25.55%",
          "chgp_class": "positive"
        },
        {
          "field": "Operating Profit Margin (Excl OI)",
          "val1": "32.74%",
          "val2": "32.22%",
          "chgp": "0.52%",
          "chgp_class": "positive"
        }
      ]
    }
  },
  {
    "link": "annual",
    "btn_text": "All Annual Results",
    "header": "Annual Results Snapshot (Consolidated) - Mar'26",
    "rhs": [
      {
        "prefix": "Net Sales ",
        "suffix": "YoY Growth in year ended Mar 2026 is 21.40% vs 7.35% in Mar 2025",
        "dir": 1
      },
      {
        "prefix": "Consolidated Net Profit ",
        "suffix": "YoY Growth in year ended Mar 2026 is 11.88% vs 15.40% in Mar 2025",
        "dir": -1
      }
    ],
    "table": {
      "header": [
        "Mar'26",
        "Mar'25",
        "Change(%)"
      ],
      "body": [
        {
          "field": "Net Sales",
          "val1": "13,980.00",
          "val2": "11,516.00",
          "chgp": "21.40%",
          "chgp_class": "positive"
        },
        {
          "field": "Operating Profit (PBDIT) excl Other Income",
          "val1": "4,559.00",
          "val2": "3,721.00",
          "chgp": "22.52%",
          "chgp_class": "positive"
        },
        {
          "field": "Interest",
          "val1": "385.00",
          "val2": "252.00",
          "chgp": "52.78%",
          "chgp_class": "negative"
        },
        {
          "field": "Exceptional Items",
          "val1": "-89.00",
          "val2": "-24.00",
          "chgp": "-270.83%",
          "chgp_class": "negative"
        },
        {
          "field": "Consolidate Net Profit",
          "val1": "2,138.00",
          "val2": "1,911.00",
          "chgp": "11.88%",
          "chgp_class": "positive"
        },
        {
          "field": "Operating Profit Margin (Excl OI)",
          "val1": "33.15%",
          "val2": "32.88%",
          "chgp": "0.27%",
          "chgp_class": "positive"
        }
      ]
    }
  }
]

Quarterly Results Snapshot (Consolidated) - Jun'26 - QoQstock-summary

Jun'26
Mar'26
Change(%)
Net Sales
4,921.00
4,197.00
17.25%
Operating Profit (PBDIT) excl Other Income
1,664.00
1,356.00
22.71%
Interest
305.00
236.00
29.24%
Exceptional Items
-21.00
-66.00
68.18%
Consolidate Net Profit
566.00
364.00
55.49%
Operating Profit Margin (Excl OI)
34.42%
32.85%
1.57%
Values in Rs Cr.
Direction Arrows
Net Sales

QoQ Growth in quarter ended Jun 2026 is 17.25% vs 27.07% in Mar 2026

Direction Arrows
Consolidated Net Profit

QoQ Growth in quarter ended Jun 2026 is 55.49% vs -42.68% in Mar 2026

Half Yearly Results Snapshot (Consolidated) - Sep'25stock-summary

Sep'25
Sep'24
Change(%)
Net Sales
6,480.00
5,748.00
12.73%
Operating Profit (PBDIT) excl Other Income
2,115.00
1,843.00
14.76%
Interest
104.00
139.00
-25.18%
Exceptional Items
-13.00
0.00
Consolidate Net Profit
1,139.00
910.00
25.16%
Operating Profit Margin (Excl OI)
33.18%
32.64%
0.54%
Values in Rs Cr.
Direction Arrows
Net Sales

Growth in half year ended Sep 2025 is 12.73% vs 9.46% in Sep 2024

Direction Arrows
Consolidated Net Profit

Growth in half year ended Sep 2025 is 25.16% vs 19.11% in Sep 2024

Nine Monthly Results Snapshot (Consolidated) - Dec'25stock-summary

Dec'25
Dec'24
Change(%)
Net Sales
9,783.00
8,557.00
14.33%
Operating Profit (PBDIT) excl Other Income
3,203.00
2,757.00
16.18%
Interest
149.00
196.00
-23.98%
Exceptional Items
-23.00
0.00
Consolidate Net Profit
1,774.00
1,413.00
25.55%
Operating Profit Margin (Excl OI)
32.74%
32.22%
0.52%
Values in Rs Cr.
Direction Arrows
Net Sales

YoY Growth in nine months ended Dec 2025 is 14.33% vs 7.19% in Dec 2024

Direction Arrows
Consolidated Net Profit

YoY Growth in nine months ended Dec 2025 is 25.55% vs 17.07% in Dec 2024

Annual Results Snapshot (Consolidated) - Mar'26stock-summary

Mar'26
Mar'25
Change(%)
Net Sales
13,980.00
11,516.00
21.40%
Operating Profit (PBDIT) excl Other Income
4,559.00
3,721.00
22.52%
Interest
385.00
252.00
52.78%
Exceptional Items
-89.00
-24.00
-270.83%
Consolidate Net Profit
2,138.00
1,911.00
11.88%
Operating Profit Margin (Excl OI)
33.15%
32.88%
0.27%
Values in Rs Cr.
Direction Arrows
Net Sales

YoY Growth in year ended Mar 2026 is 21.40% vs 7.35% in Mar 2025

Direction Arrows
Consolidated Net Profit

YoY Growth in year ended Mar 2026 is 11.88% vs 15.40% in Mar 2025

stock-summaryCompany CV
About Torrent Pharmaceuticals Ltd. stock-summary
stock-summary
Torrent Pharmaceuticals Ltd.
Large Cap
Pharmaceuticals & Biotechnology
Torrent Pharmaceuticals Limited is a leading player in the Indian pharmaceutical sector, concentrating on the chronic and sub-chronic therapeutic segments. The Company has established itself as a leader in developing niche pharmaceutical solutions through its patient-centric innovation. The Company is a dominant player in the therapeutic areas of Cardiovascular (CV), Central Nervous System (CNS), Vitamins and Nutrients (VMN), Gastro-Intestinal (GI) and Anti-Diabetes (AD) therapies in India.
Company Coordinates stock-summary
Company Details
Torrent House, Off Ashram Road Ahmedabad Gujarat : 380009
stock-summary
Tel: 91-79-26599000
stock-summary
investorservices@torrentpharma.com
Registrar Details
Karvy Computershare Pvt Ltd, Plot No 17-24 , Near Image Hospital,, Reliance Cybervilae,Vithalrao Nagar,, Madhapur, Hyderabad