
Compare Torrent Pharma with Similar Stocks
Dashboard
High Management Efficiency with a high ROCE of 21.88%
Strong ability to service debt as the company has a low Debt to EBITDA ratio of 3.30 times
With ROCE of 16.1, it has a Very Expensive valuation with a 7.6 Enterprise value to Capital Employed
High Institutional Holdings at 25.25%
Consistent Returns over the last 3 years
Stock DNA
Pharmaceuticals & Biotechnology
INR 148,539 Cr (Large Cap)
68.00
34
0.86%
1.55
26.24%
17.84
Total Returns (Price + Dividend) 
Latest dividend: 8.924850208185234 per share ex-dividend date: May-29-2026
Risk Adjusted Returns v/s
Returns Beta

News
Torrent Pharmaceuticals Ltd. is Rated Hold by MarketsMOJO
Torrent Pharmaceuticals Ltd. is rated 'Hold' by MarketsMOJO, with this rating last updated on 22 May 2026. However, the analysis and financial metrics discussed below reflect the stock's current position as of 19 June 2026, providing investors with an up-to-date perspective on the company’s fundamentals, valuation, financial trends, and technical outlook.
Read full news article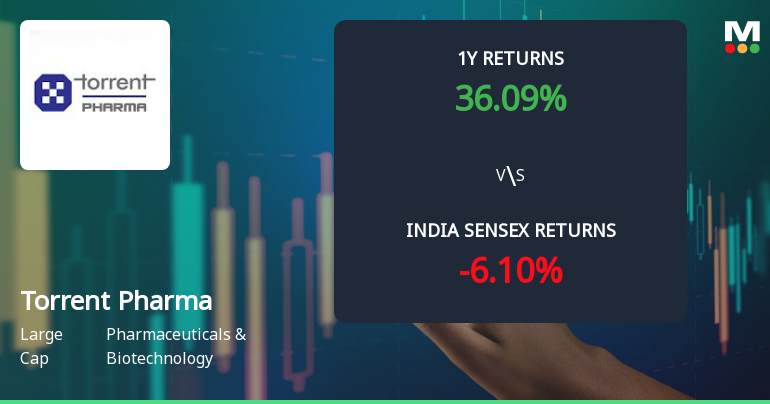
Technical Momentum Shifts Temper Torrent Pharmaceuticals’ Outlook Despite Strong Long-Term Returns
Torrent Pharmaceuticals Ltd., a stalwart in the Pharmaceuticals & Biotechnology sector, has experienced a subtle but notable shift in its technical momentum, prompting a downgrade in its mojo grade from Buy to Hold as of 23 Dec 2025. Despite strong long-term returns and a large-cap market cap grade, recent technical indicators suggest a cautious stance for investors amid mixed signals from key momentum and volume metrics.
Read full news article
Technical Momentum Shifts Bolster Torrent Pharmaceuticals’ Outlook Despite Recent Price Dip
Torrent Pharmaceuticals Ltd., a prominent player in the Pharmaceuticals & Biotechnology sector, has experienced a notable shift in its technical momentum, moving from a mildly bullish stance to a more confident bullish trend. Despite a slight dip in the stock price on 16 Jun 2026, the underlying technical indicators suggest a strengthening momentum that investors should carefully analyse in the context of broader market movements and sector dynamics.
Read full news article Announcements
Disclosure Under Regulation 30 Of The SEBI (Listing Obligations And Disclosure Requirements) Regulations 2015 (Listing Regulations)
03-Jun-2026 | Source : BSEWeb Link Letter - Annual Report to shareholders
Announcement under Regulation 30 (LODR)-Newspaper Publication
02-Jun-2026 | Source : BSENewspaper advertisement in respect of AGM & E-voting procedure
Business Responsibility and Sustainability Reporting (BRSR)
01-Jun-2026 | Source : BSEBRSR 2025-26
Corporate Actions

No Upcoming Board Meetings

Torrent Pharmaceuticals Ltd. has declared 180% dividend, ex-date: 29 May 26

Torrent Pharmaceuticals Ltd. has announced 5:10 stock split, ex-date: 20 Feb 06

Torrent Pharmaceuticals Ltd. has announced 1:1 bonus issue, ex-date: 08 Jul 22

No Rights history available
Quality key factors
Valuation key factors
Technicals key factors
 Technical Indicator Scale: Bearish, Mildly Bearish, Sideways, Mildly Bullish, Bullish Turned
 Shareholding Snapshot : Mar 2026
Shareholding Compare (%holding)
Promoters
None
Held by 41 Schemes (4.45%)
Held by 864 FIIs (16.18%)
Torrent Investments Limited (formerly Known As Torrent Investments Private Limited) (68.31%)
Nps Trust (2.49%)
4.12%
Quarterly Results Snapshot (Consolidated) - Mar'26 - QoQ

QoQ Growth in quarter ended Mar 2026 is 27.07% vs 0.03% in Dec 2025

QoQ Growth in quarter ended Mar 2026 is -42.68% vs 7.45% in Dec 2025
Half Yearly Results Snapshot (Consolidated) - Sep'25
Growth in half year ended Sep 2025 is 12.73% vs 9.46% in Sep 2024
Growth in half year ended Sep 2025 is 25.16% vs 19.11% in Sep 2024
Nine Monthly Results Snapshot (Consolidated) - Dec'25
YoY Growth in nine months ended Dec 2025 is 14.33% vs 7.19% in Dec 2024
YoY Growth in nine months ended Dec 2025 is 25.55% vs 17.07% in Dec 2024
Annual Results Snapshot (Consolidated) - Mar'26
YoY Growth in year ended Mar 2026 is 21.40% vs 7.35% in Mar 2025
YoY Growth in year ended Mar 2026 is 11.88% vs 15.40% in Mar 2025
About Torrent Pharmaceuticals Ltd.

Company Coordinates


