
Compare Transglobe Foods with Similar Stocks
Dashboard
With a Negative Book Value, the company has a Weak Long Term Fundamental Strength
- Poor long term growth as Net Sales has grown by an annual rate of % and Operating profit at 0% over the last 5 years
- The company has a negative book value of Rs 0.43 crore
Flat results in Mar 26
Risky - Negative Book Value
Stock DNA
Beverages
INR 6 Cr (Micro Cap)
NA (Loss Making)
21
0.00%
-0.43
5.00%
-6.29
Total Returns (Price + Dividend) 
Transglobe Foods for the last several years.
Risk Adjusted Returns v/s
Returns Beta

News
Are Transglobe Foods Ltd latest results good or bad?
Transglobe Foods Ltd's latest financial results for Q4 FY25 reflect a complex operational landscape. The company reported net sales of ₹0.18 crores, which remained unchanged compared to the same quarter in the previous year. This indicates a pattern of sporadic revenue generation, as the company recorded no sales in the preceding three quarters of FY25. In terms of profitability, Transglobe Foods achieved a net profit of ₹0.12 crores, a notable turnaround from a loss of ₹0.07 crores in the previous quarter. This resulted in a profit margin of 66.67%, which, while appearing strong, is reflective of the minimal operational scale rather than robust profitability. The operating profit margin for the quarter was 72.22%, suggesting efficiency during the brief period of revenue generation. However, the financial health of the company raises significant concerns. Transglobe Foods reported negative shareholder eq...
Read full news article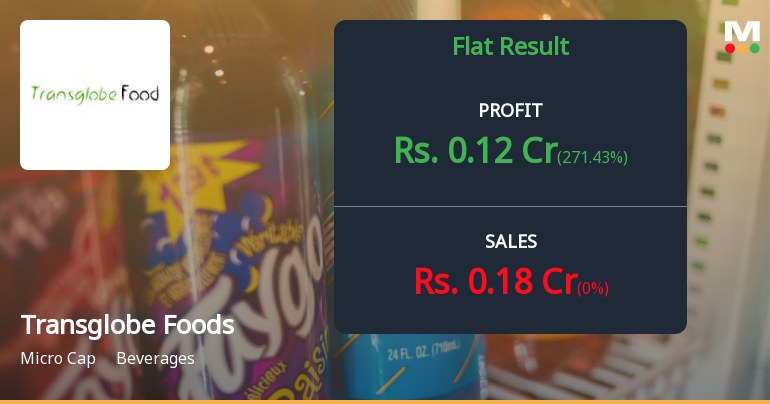
Transglobe Foods Q4 FY25: Micro-Cap Beverage Company Returns to Profit Amid Sporadic Operations
Transglobe Foods Limited, a micro-cap beverage company with a market capitalisation of ₹7.00 crores, reported a net profit of ₹0.12 crores in Q4 FY25 (Mar'26), marking a return to profitability after three consecutive loss-making quarters. However, the company's sporadic operational pattern—with revenue recorded only in March quarters—raises serious concerns about business sustainability and operational viability.
Read full news article Announcements
Announcement under Regulation 30 (LODR)-Newspaper Publication
29-May-2026 | Source : BSEPublication of financial results in newspaper.
Board Meeting Intimation for To Be Held On Wednesday 27Th May 2026
18-May-2026 | Source : BSETransglobe Foods Ltdhas informed BSE that the meeting of the Board of Directors of the Company is scheduled on 27/05/2026 inter alia to consider and approve Audited Financial Statement of the company for the Financial Year ended 31st March 2026.
Compliances-Reg.24(A)-Annual Secretarial Compliance
12-May-2026 | Source : BSENon applicability of Regulation 24 (A). Please find enclosed intimation.
Corporate Actions

No Upcoming Board Meetings

No Dividend history available

No Splits history available

No Bonus history available

No Rights history available
Quality key factors
Valuation key factors
Technicals key factors
 Technical Indicator Scale: Bearish, Mildly Bearish, Sideways, Mildly Bullish, Bullish Turned
 Shareholding Snapshot : Mar 2026
Shareholding Compare (%holding)
Non Institution
None
Held by 0 Schemes
Held by 0 FIIs
Rich And Relish Ice Cream Private Limited (12.13%)
Bhavesh Parekh Huf (4.76%)
61.75%
Quarterly Results Snapshot (Standalone) - Mar'26 - QoQ
QoQ Growth in quarter ended Mar 2026 is 0.00% vs 0.00% in Dec 2025

QoQ Growth in quarter ended Mar 2026 is 271.43% vs -40.00% in Dec 2025
Half Yearly Results Snapshot (Standalone) - Sep'25
Growth in half year ended Sep 2025 is 0.00% vs 0.00% in Sep 2024

Growth in half year ended Sep 2025 is -11.11% vs 55.00% in Sep 2024
Nine Monthly Results Snapshot (Standalone) - Dec'25
YoY Growth in nine months ended Dec 2025 is 0.00% vs 0.00% in Dec 2024
YoY Growth in nine months ended Dec 2025 is -6.25% vs 36.00% in Dec 2024
Annual Results Snapshot (Standalone) - Mar'26
YoY Growth in year ended Mar 2026 is 0.00% vs 0.00% in Mar 2025
YoY Growth in year ended Mar 2026 is -66.67% vs 89.66% in Mar 2025
About Transglobe Foods Ltd

Company Coordinates


