
Compare Transpek Inds. with Similar Stocks
Dashboard
Poor long term growth as Net Sales has grown by an annual rate of 12.85% and Operating profit at 19.16% over the last 5 years
With a fall in Net Sales of -6.47%, the company declared Very Negative results in Mar 26
Despite the size of the company, domestic mutual funds hold only 0% of the company
Consistent Underperformance against the benchmark over the last 3 years
Stock DNA
Commodity Chemicals
INR 559 Cr (Micro Cap)
12.00
46
1.97%
-0.07
5.95%
0.74
Total Returns (Price + Dividend) 
Latest dividend: 20 per share ex-dividend date: Aug-26-2025
Risk Adjusted Returns v/s
Returns Beta

News

Transpek Industry Ltd Valuation Shifts Signal Renewed Price Attractiveness Amid Sector Challenges
Transpek Industry Ltd has witnessed a notable improvement in its valuation parameters, shifting from a very attractive to an attractive rating, despite ongoing headwinds in the commodity chemicals sector. This recalibration in price metrics, coupled with a recent 7.36% intraday surge, invites a closer examination of the stock’s price attractiveness relative to its historical averages and peer group benchmarks.
Read full news article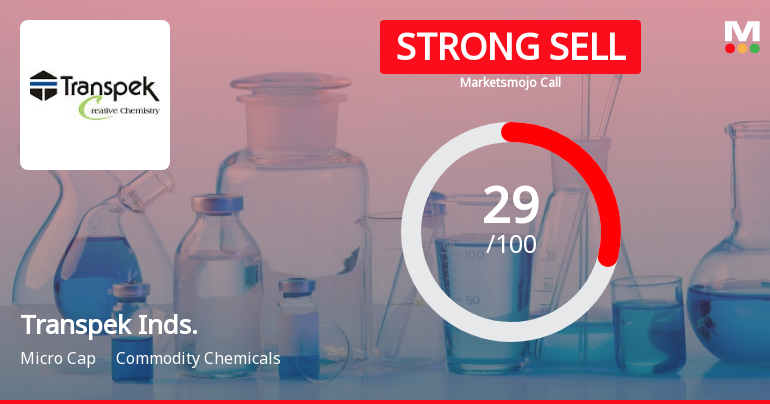
Transpek Industry Ltd is Rated Strong Sell
Transpek Industry Ltd is rated Strong Sell by MarketsMOJO, with this rating last updated on 01 June 2026. However, the analysis and financial metrics presented here reflect the stock's current position as of 16 July 2026, providing investors with an up-to-date view of the company’s performance and outlook.
Read full news article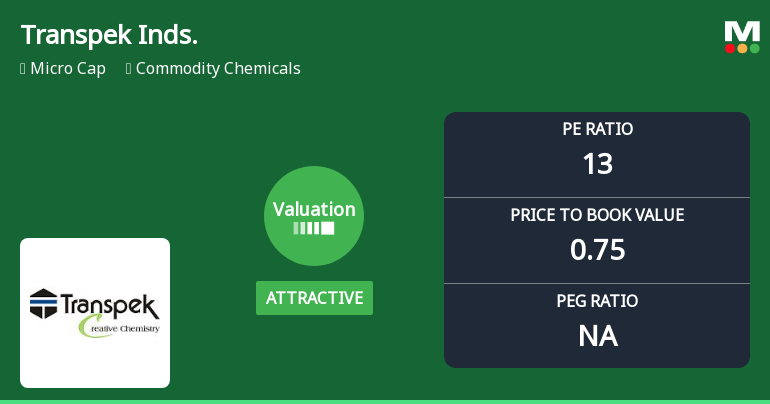
Transpek Industry Ltd Valuation Shifts to Attractive Amidst Challenging Market Returns
Transpek Industry Ltd, a micro-cap player in the commodity chemicals sector, has seen its valuation parameters improve from very attractive to attractive, signalling a shift in price appeal despite ongoing challenges in stock performance relative to the broader market. This article analyses the recent changes in key valuation metrics, compares them with peer averages, and assesses the implications for investors amid a backdrop of subdued returns and a strong sell mojo grade.
Read full news article Announcements
Announcement under Regulation 30 (LODR)-Change in Management
13-Jul-2026 | Source : BSEIntimation of Resignation of Dr. Gurpreet Kaur - Senior General Manager R&D and QC effective at the close of business hours on 15th July 2026.
Announcement Under Regulation 30 Of SEBI LODR Regulations 2015.
08-Jul-2026 | Source : BSEIntimation of use of Responsible Care logo for a period of 3 years from July 2026 to June 2029.
Compliances-Certificate under Reg. 74 (5) of SEBI (DP) Regulations 2018
06-Jul-2026 | Source : BSECompliance Certificate under Regulation 74(5) of SEBI DP Regulations 2018.
Corporate Actions

No Upcoming Board Meetings

Transpek Industry Ltd has declared 200% dividend, ex-date: 26 Aug 25

No Splits history available

No Bonus history available

No Rights history available
Quality key factors
Valuation key factors
Technicals key factors
 Technical Indicator Scale: Bearish, Mildly Bearish, Sideways, Mildly Bullish, Bullish Turned
 Shareholding Snapshot : Mar 2026
Shareholding Compare (%holding)
Promoters
None
Held by 0 Schemes
Held by 2 FIIs (0.02%)
Anshul Specialty Molecules Private Limited (24.64%)
Mukul Mahavir Agrawal (2.12%)
31.17%
Quarterly Results Snapshot (Consolidated) - Mar'26 - QoQ

QoQ Growth in quarter ended Mar 2026 is -6.47% vs -1.12% in Dec 2025
QoQ Growth in quarter ended Mar 2026 is -39.35% vs -14.16% in Dec 2025
Half Yearly Results Snapshot (Consolidated) - Sep'25
Growth in half year ended Sep 2025 is -0.02% vs 11.11% in Sep 2024

Growth in half year ended Sep 2025 is 49.79% vs 0.00% in Sep 2024
Nine Monthly Results Snapshot (Consolidated) - Dec'25
YoY Growth in nine months ended Dec 2025 is -2.40% vs 12.33% in Dec 2024
YoY Growth in nine months ended Dec 2025 is 32.49% vs -10.42% in Dec 2024
Annual Results Snapshot (Consolidated) - Mar'26
YoY Growth in year ended Mar 2026 is -4.41% vs 12.11% in Mar 2025
YoY Growth in year ended Mar 2026 is -6.34% vs 26.40% in Mar 2025
About Transpek Industry Ltd

Company Coordinates


