
Compare Transwar.Fin. with Similar Stocks
Dashboard
With a Operating Losses, the company has a Weak Long Term Fundamental Strength
- Poor long term growth as Operating profit has grown by an annual rate of -23.62%
Negative results in Mar 26
Risky - Negative EBITDA
47.16% of Promoter Shares are Pledged
Below par performance in long term as well as near term
Stock DNA
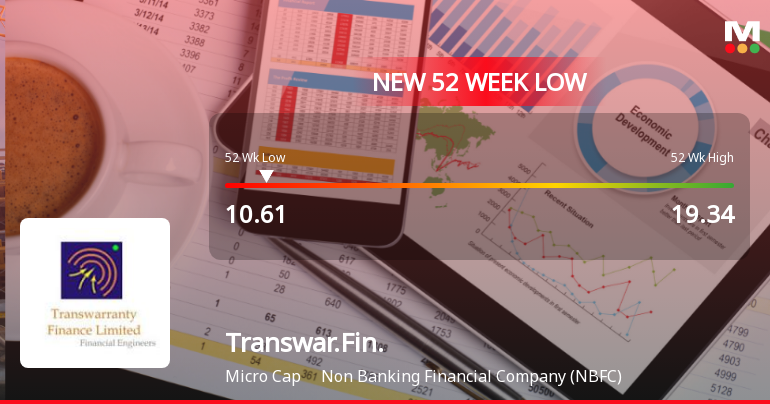
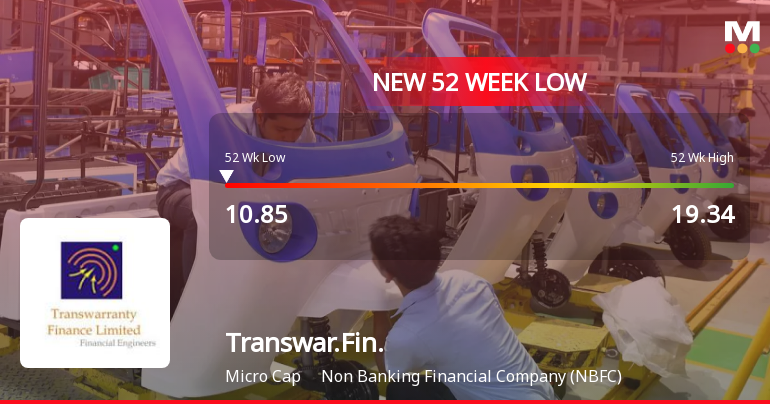
Non Banking Financial Company (NBFC)
INR 64 Cr (Micro Cap)
NA (Loss Making)
21
0.00%
1.07
-12.94%
2.12
Total Returns (Price + Dividend) 
Latest dividend: 0.5 per share ex-dividend date: Sep-04-2012
Risk Adjusted Returns v/s
Returns Beta

News

Transwarranty Finance Ltd is Rated Strong Sell
Transwarranty Finance Ltd is rated Strong Sell by MarketsMOJO. This rating was last updated on 09 Jan 2025. However, the analysis and financial metrics discussed below reflect the stock’s current position as of 10 July 2026, providing investors with an up-to-date view of the company’s fundamentals, valuation, financial trends, and technical outlook.
Read full news article Announcements
Compliances-Certificate under Reg. 74 (5) of SEBI (DP) Regulations 2018
11-Jul-2026 | Source : BSESubmission Under Regulation 74 (5) of SEBI (DP) Regulations 2018.
Board Meeting Outcome for Outcome Of Board Meeting Held On July 10 2026
10-Jul-2026 | Source : BSEOutcome of Board Meeting held on July 10 2026
Board Meeting Intimation for The Issuance Of Unlisted Non-Convertible Debentures On Private Placement Basis.
03-Jul-2026 | Source : BSETranswarranty Finance Ltdhas informed BSE that the meeting of the Board of Directors of the Company is scheduled on 10/07/2026 inter alia to consider and approve the issuance of Unlisted Non-Convertible Debentures on Private Placement basis.
Corporate Actions

No Upcoming Board Meetings

Transwarranty Finance Ltd has declared 5% dividend, ex-date: 04 Sep 12

No Splits history available

No Bonus history available

Transwarranty Finance Ltd has announced 1:1 rights issue, ex-date: 04 Nov 22
Quality key factors
Valuation key factors
Technicals key factors
 Technical Indicator Scale: Bearish, Mildly Bearish, Sideways, Mildly Bullish, Bullish Turned
 Shareholding Snapshot : Mar 2026
Shareholding Compare (%holding)
Promoters
47.1609
Held by 0 Schemes
Held by 0 FIIs
Kumar Nair (51.45%)
Sidharth R Ajwani (3.1%)
21.41%
Quarterly Results Snapshot (Consolidated) - Mar'26 - QoQ

QoQ Growth in quarter ended Mar 2026 is 29.39% vs -5.44% in Dec 2025

QoQ Growth in quarter ended Mar 2026 is -53.85% vs 27.78% in Dec 2025
Half Yearly Results Snapshot (Consolidated) - Sep'25
Growth in half year ended Sep 2025 is -11.57% vs 38.45% in Sep 2024
Growth in half year ended Sep 2025 is -2,750.00% vs 105.10% in Sep 2024
Nine Monthly Results Snapshot (Consolidated) - Dec'25
YoY Growth in nine months ended Dec 2025 is -11.50% vs 31.03% in Dec 2024
YoY Growth in nine months ended Dec 2025 is -34.07% vs -17.10% in Dec 2024
Annual Results Snapshot (Consolidated) - Mar'26
YoY Growth in year ended Mar 2026 is -3.15% vs 5.75% in Mar 2025
YoY Growth in year ended Mar 2026 is 18.30% vs -776.25% in Mar 2025
About Transwarranty Finance Ltd

Company Coordinates


