
Compare Tree House Edu. with Similar Stocks
Dashboard
With a Operating Losses, the company has a Weak Long Term Fundamental Strength
- Poor long term growth as Net Sales has grown by an annual rate of -4.56% over the last 5 years
- Company's ability to service its debt is weak with a poor EBIT to Interest (avg) ratio of -5.16
Negative results in Mar 26
Risky - Negative EBITDA
83.17% of Promoter Shares are Pledged
Below par performance in long term as well as near term
Stock DNA
Other Consumer Services
INR 28 Cr (Micro Cap)
NA (Loss Making)
NA
0.00%
0.03
-5.05%
0.16
Total Returns (Price + Dividend) 
Latest dividend: 2 per share ex-dividend date: Sep-16-2015
Risk Adjusted Returns v/s
Returns Beta

News

Tree House Education & Accessories Ltd is Rated Strong Sell
Tree House Education & Accessories Ltd is rated Strong Sell by MarketsMOJO. This rating was last updated on 16 May 2026, reflecting a reassessment of the stock’s outlook. However, all fundamentals, returns, and financial metrics discussed below are current as of 10 July 2026, providing investors with the latest perspective on the company’s position.
Read full news article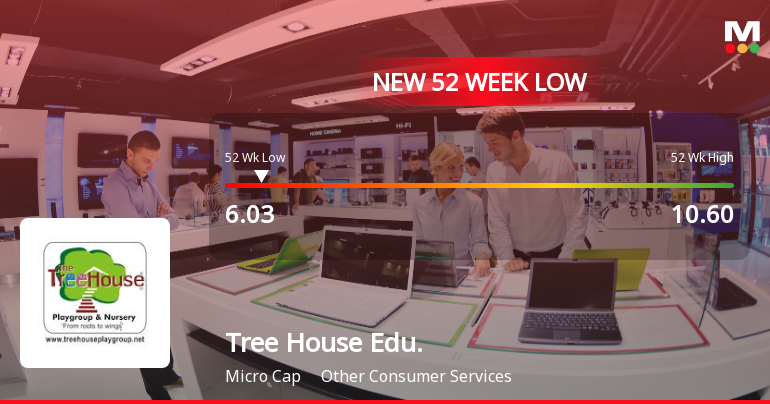
Tree House Education & Accessories Ltd Falls to 52-Week Low of Rs 6.03 as Sell-Off Deepens
For the third consecutive session, Tree House Education & Accessories Ltd has seen its share price decline, culminating in a fresh 52-week low of Rs 6.03 on 8 Jul 2026. This latest drop extends the stock’s downward trajectory to nearly 10% over just three days, underscoring persistent selling pressure amid challenging fundamentals.
Read full news article
Tree House Education & Accessories Ltd Forms Death Cross, Signalling Bearish Trend
Tree House Education & Accessories Ltd has recently formed a Death Cross, a significant technical indicator where the 50-day moving average crosses below the 200-day moving average. This development signals a potential deterioration in the stock’s trend and raises concerns about its long-term weakness amid already challenging fundamentals and market performance.
Read full news article Announcements
Tree House Education & Accessories Limited - Reply to Clarification- Financial results
05-Dec-2019 | Source : NSETree House Education & Accessories Limitede House Education & Accessories Limited for the quarter ended 30-Sep-2019 with respect to Regulation 33 of the SEBI (Listing Obligations and Disclosure Requirements) Regulations, 2015.
Tree House Education & Accessories Limited - Clarification - Financial Results
03-Dec-2019 | Source : NSETree House Education & Accessories Limited Education & Accessories Limited for the quarter ended 30-Sep-2019 with respect to Regulation 33 of the SEBI (Listing Obligations and Disclosure Requirements) Regulations, 2015.
Tree House Education & Accessories Limited - Updates
27-Nov-2019 | Source : NSETree House Education & Accessories Limited has informed the Exchange regarding 'Disclosure under Regulation 30 of the SEBI (Listing Obligations and Disclosure Requirements) Regulation, 2015áregardingásettlement of loan with KotakáMahindra BankáLimitedáand shifting of Registered Office.á'.
Corporate Actions

No Upcoming Board Meetings

Tree House Education & Accessories Ltd has declared 20% dividend, ex-date: 16 Sep 15

No Splits history available

No Bonus history available

No Rights history available
Quality key factors
Valuation key factors
Technicals key factors
 Technical Indicator Scale: Bearish, Mildly Bearish, Sideways, Mildly Bullish, Bullish Turned
 Shareholding Snapshot : Mar 2026
Shareholding Compare (%holding)
Non Institution
83.1668
Held by 0 Schemes
Held by 3 FIIs (7.14%)
Rajesh Doulatram Bhatia (12.0%)
Fc Vi India Venture Mauritius Ltd (6.85%)
48.54%
Quarterly Results Snapshot (Consolidated) - Mar'26 - YoY

YoY Growth in quarter ended Mar 2026 is -67.02% vs -3.09% in Mar 2025
YoY Growth in quarter ended Mar 2026 is -1,075.32% vs 38.40% in Mar 2025
Half Yearly Results Snapshot (Consolidated) - Sep'25
Growth in half year ended Sep 2025 is -41.45% vs 5.96% in Sep 2024

Growth in half year ended Sep 2025 is 105.71% vs 38.60% in Sep 2024
Nine Monthly Results Snapshot (Consolidated) - Dec'25
YoY Growth in nine months ended Dec 2025 is -42.11% vs -1.13% in Dec 2024
YoY Growth in nine months ended Dec 2025 is 96.13% vs 28.74% in Dec 2024
Annual Results Snapshot (Consolidated) - Mar'26
YoY Growth in year ended Mar 2026 is -44.20% vs -12.48% in Mar 2025
YoY Growth in year ended Mar 2026 is 42.00% vs -354.76% in Mar 2025
About Tree House Education & Accessories Ltd

Company Coordinates


