
Compare Trejhara Solutio with Similar Stocks
Dashboard
Weak Long Term Fundamental Strength with a -21.79% CAGR growth in Operating Profits over the last 5 years
- Company's ability to service its debt is weak with a poor EBIT to Interest (avg) ratio of -2.88
- The company has been able to generate a Return on Equity (avg) of 1.89% signifying low profitability per unit of shareholders funds
Underperformed the market in the last 1 year
Stock DNA
Computers - Software & Consulting
INR 330 Cr (Micro Cap)
37.00
32
0.00%
0.01
2.97%
1.08
Total Returns (Price + Dividend) 
Latest dividend: 0.5 per share ex-dividend date: Sep-16-2022
Risk Adjusted Returns v/s
Returns Beta

News

Trejhara Solutions Ltd is Rated Strong Sell
Trejhara Solutions Ltd is rated Strong Sell by MarketsMOJO, with this rating last updated on 13 February 2026. However, the analysis and financial metrics discussed here reflect the stock’s current position as of 11 June 2026, providing investors with an up-to-date perspective on the company’s fundamentals, valuation, financial trend, and technical outlook.
Read full news article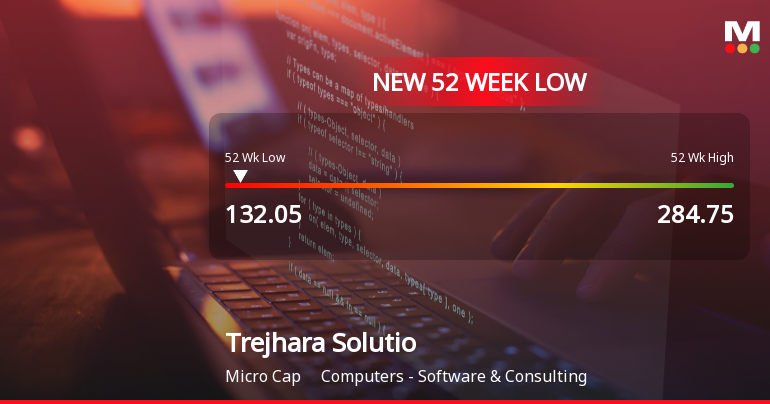
Markets Rally, But Trejhara Solutions Ltd Sinks to 52-Week Low in Stock-Specific Sell-Off
Despite a broadly positive market environment, Trejhara Solutions Ltd has plunged to a fresh 52-week low of Rs 132.05 on 10 Jun 2026, marking a significant 45.17% decline over the past year. This stark underperformance contrasts sharply with the Sensex, which has fallen just 9.78% over the same period, underscoring the stock-specific pressures weighing on the company.
Read full news article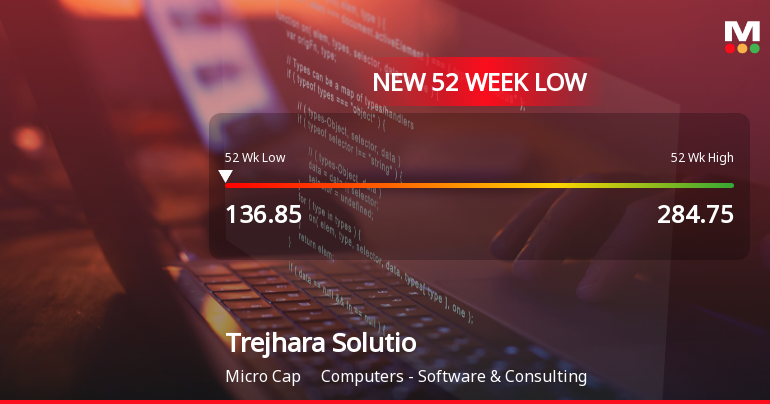
Markets Rally, But Trejhara Solutions Ltd Sinks to 52-Week Low in Stock-Specific Sell-Off
Despite a broadly positive market environment, Trejhara Solutions Ltd has slipped to a fresh 52-week low of Rs 136.7 on 9 Jun 2026, marking a continuation of its recent downward trajectory amid persistent selling pressure.
Read full news article Announcements
Compliances-Reg.24(A)-Annual Secretarial Compliance
29-May-2026 | Source : BSEAnnual Secretarial Compliance Report for the year ended 31 March 2026.
Announcement under Regulation 30 (LODR)-Newspaper Publication
22-May-2026 | Source : BSEPlease find enclosed the Newspaper Publication for Audited Financial Results for the quarter and year ended March 31 2026.
Outcome Of Board Meeting Held On May 21 2026.
21-May-2026 | Source : BSEPlease find enclosed outcome of Board Meeting held on May 21 2026 along with Financial Results.
Corporate Actions

No Upcoming Board Meetings

Trejhara Solutions Ltd has declared 5% dividend, ex-date: 16 Sep 22

No Splits history available

No Bonus history available

No Rights history available
Quality key factors
Valuation key factors
Technicals key factors
 Technical Indicator Scale: Bearish, Mildly Bearish, Sideways, Mildly Bullish, Bullish Turned
 Shareholding Snapshot : Mar 2026
Shareholding Compare (%holding)
Non Institution
None
Held by 0 Schemes
Held by 1 FIIs (0.02%)
Marvis Investments Ltd (11.0%)
Ajay Dilkush Sarupria (9.15%)
43.24%
Quarterly Results Snapshot (Consolidated) - Mar'26 - QoQ

QoQ Growth in quarter ended Mar 2026 is 23.84% vs -0.35% in Dec 2025
QoQ Growth in quarter ended Mar 2026 is 154.55% vs -66.11% in Dec 2025
Half Yearly Results Snapshot (Consolidated) - Sep'25

Growth in half year ended Sep 2025 is 43.50% vs 361.13% in Sep 2024
Growth in half year ended Sep 2025 is 73.06% vs -68.59% in Sep 2024
Nine Monthly Results Snapshot (Consolidated) - Dec'25
YoY Growth in nine months ended Dec 2025 is 90.08% vs 221.62% in Dec 2024
YoY Growth in nine months ended Dec 2025 is 75.24% vs -66.81% in Dec 2024
Annual Results Snapshot (Consolidated) - Mar'26
YoY Growth in year ended Mar 2026 is 22.89% vs 406.56% in Mar 2025
YoY Growth in year ended Mar 2026 is 101.18% vs -78.50% in Mar 2025
About Trejhara Solutions Ltd

Company Coordinates


