
Compare TRF with Similar Stocks
Stock DNA
Industrial Manufacturing
INR 244 Cr (Micro Cap)
35.00
35
0.00%
-1.29
8.20%
2.90
Total Returns (Price + Dividend) 
Latest dividend: 4 per share ex-dividend date: Jul-10-2012
Risk Adjusted Returns v/s
Returns Beta

News
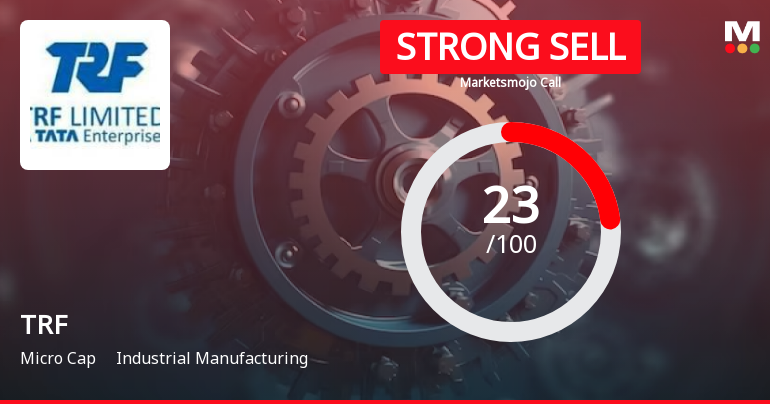
TRF Ltd is Rated Strong Sell
TRF Ltd is rated Strong Sell by MarketsMOJO, with this rating last updated on 16 June 2025. However, the analysis and financial metrics discussed here reflect the stock’s current position as of 11 June 2026, providing investors with an up-to-date view of the company’s performance and outlook.
Read full news article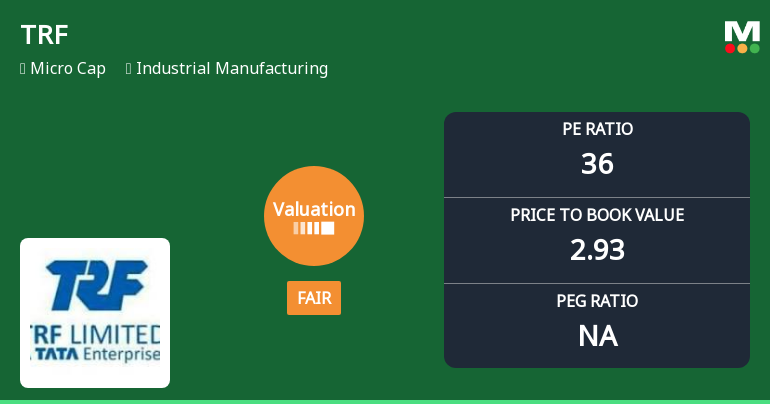
TRF Ltd Valuation Shifts to Fair Amidst Market Downturn and Peer Comparison
TRF Ltd, a micro-cap player in the industrial manufacturing sector, has seen its valuation metrics adjust notably over the past year, shifting from an expensive to a fair valuation band. Despite this recalibration, the stock has underperformed the broader market, reflecting ongoing challenges in profitability and investor sentiment.
Read full news article
TRF Ltd is Rated Strong Sell
TRF Ltd is rated Strong Sell by MarketsMOJO, with this rating last updated on 16 Jun 2025. However, the analysis and financial metrics discussed here reflect the company’s current position as of 27 May 2026, providing investors with the latest insights into its performance and outlook.
Read full news article Announcements
Compliances-Reg.24(A)-Annual Secretarial Compliance
28-May-2026 | Source : BSEAnnual Secretarial Compliance Report for the year ended March 31 2026 is enclosed.
Announcement under Regulation 30 (LODR)-Newspaper Publication
15-May-2026 | Source : BSENewspaper advertisement
Shareholder Meeting / Postal Ballot-Notice of Postal Ballot
14-May-2026 | Source : BSENotice of Postal Ballot
Corporate Actions

No Upcoming Board Meetings

TRF Ltd has declared 40% dividend, ex-date: 10 Jul 12

No Splits history available

TRF Ltd has announced 1:1 bonus issue, ex-date: 31 Jul 09

No Rights history available
Quality key factors
Valuation key factors
Technicals key factors
 Technical Indicator Scale: Bearish, Mildly Bearish, Sideways, Mildly Bullish, Bullish Turned
 Shareholding Snapshot : Mar 2026
Shareholding Compare (%holding)
Non Institution
None
Held by 1 Schemes (0.0%)
Held by 2 FIIs (0.49%)
Tata Steel Limited (34.11%)
Roopa Corporate Services Pvt. Ltd. (2.84%)
50.85%
Quarterly Results Snapshot (Consolidated) - Mar'26 - YoY

YoY Growth in quarter ended Mar 2026 is -28.48% vs -28.66% in Mar 2025

YoY Growth in quarter ended Mar 2026 is -296.31% vs -44.13% in Mar 2025
Half Yearly Results Snapshot (Consolidated) - Sep'25
Growth in half year ended Sep 2025 is -34.92% vs -3.92% in Sep 2024
Growth in half year ended Sep 2025 is -129.97% vs -59.36% in Sep 2024
Nine Monthly Results Snapshot (Consolidated) - Dec'25
YoY Growth in nine months ended Dec 2025 is -29.88% vs -8.17% in Dec 2024
YoY Growth in nine months ended Dec 2025 is -89.05% vs -21.27% in Dec 2024
Annual Results Snapshot (Consolidated) - Mar'26
YoY Growth in year ended Mar 2026 is -29.57% vs -13.74% in Mar 2025
YoY Growth in year ended Mar 2026 is -117.33% vs -25.46% in Mar 2025
About TRF Ltd

Company Coordinates


