
Compare Tricom Fruit with Similar Stocks
Dashboard
Weak Long Term Fundamental Strength as the company has not declared results in the last 6 months
- Poor long term growth as Net Sales has grown by an annual rate of 0% and Operating profit at 0% over the last 5 years
- The company has a negative book value of Rs 86.80 crore
Flat results in Sep 24
Risky - No result in last 6 months
62.69% of Promoter Shares are Pledged
Below par performance in long term as well as near term
Total Returns (Price + Dividend) 
Tricom Fruit for the last several years.
Risk Adjusted Returns v/s
Returns Beta

News
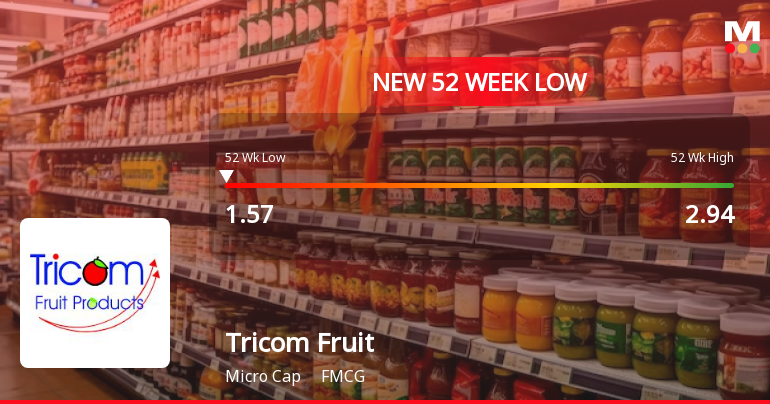
Five Consecutive Losses Push Tricom Fruit Products Ltd to a New 52-Week Low
For the fifth consecutive session, Tricom Fruit Products Ltd closed lower, slipping to a fresh 52-week low of Rs 1.57 on 3 Jul 2026, marking a cumulative decline of 17.37% over this period.
Read full news article
Markets Rally, But Tricom Fruit Products Ltd Sinks to 52-Week Low in Stock-Specific Sell-Off
While the broader market surged with the Sensex gaining 3.61% on 8 Apr 2026, Tricom Fruit Products Ltd has diverged sharply, hitting a fresh 52-week low of Rs 1.58 amid continued selling pressure.
Read full news article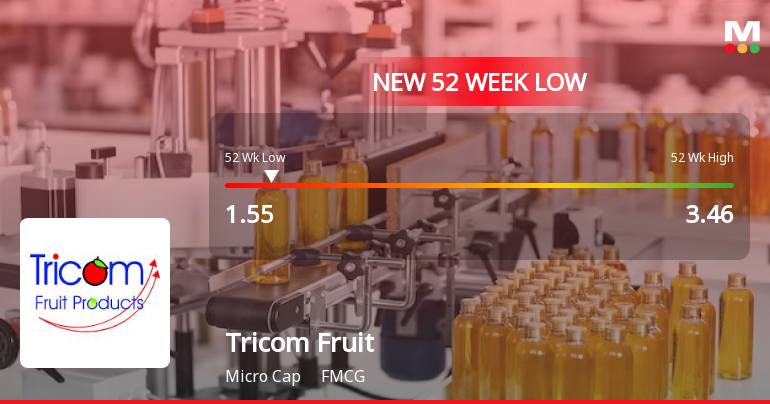
Markets Rally, But Tricom Fruit Products Ltd Sinks to 52-Week Low in Stock-Specific Sell-Off
While the broader market showed signs of recovery, Tricom Fruit Products Ltd has continued its downward trajectory, hitting a fresh 52-week low of Rs 1.64 on 6 Apr 2026. This decline contrasts sharply with the market’s mixed performance and highlights persistent challenges facing the company.
Read full news article Announcements
Closure of Trading Window
30-Jun-2026 | Source : BSEPursuant to the Companys Code of Conduct to Regulating Monitoring and Reporting Trading by insiders (code) SEBI (Prohibition of Insider Trading) Regulation 2015 please note that the Trading window for dealing in the securities of the Company will remain closed for the Directors/ Kmp and other designated employees etc. covered under the code from 1st July 2026 till 48 hours after the declaration of the Unaudited Financial Results for the quarter ended 30th June 2026.
Announcement under Regulation 30 (LODR)-Newspaper Publication
27-May-2026 | Source : BSEPursuant to Regulation 47 of the SEBI (LODR) Regulation 2015 we are enclosing copies of newspaper advertisement of the financial results of the Company for the quarter and year ended March 31 2026 as published in Financial express and in Navrashtra on 27th May 2026.
Corporate Insolvency Resolution Process (CIRP)-Outcome of meeting of Committee of Creditors
26-May-2026 | Source : BSEPursuant to the provisions of Regulation 30 of SEBI (LODR) Regulations 2015 we wish you to inform that the CoC of the Company in their meeting held today i.e.26th May 2026 inter alia: 1.Noted the Audited Financial Results of the Company for the quarter and year ended as on 31st March 2026 and its approved by the Resolution professional. please find enclosed following :1.Audited Financial results quarter and year ended as on 31st March 2026 along with statement of assets and liabilities and cash flow statement for the year ended as on 31st March 2026 2. Auditor report on audited financial statements for the quarter and year ended as on 31st March 2026. 3 Declaration regarding Unmodified opinion.
Corporate Actions

No Upcoming Board Meetings

No Dividend history available

No Splits history available

No Bonus history available

No Rights history available
Quality key factors
Valuation key factors
Technicals key factors
 Technical Indicator Scale: Bearish, Mildly Bearish, Sideways, Mildly Bullish, Bullish Turned
 Shareholding Snapshot : Mar 2026
Shareholding Compare (%holding)
Non Institution
62.6948
Held by 0 Schemes
Held by 0 FIIs
Chetan Shantilal Kothari (3.91%)
Edelweiss Asset Recont.co Ltd. (10.47%)
62.37%
Quarterly Results Snapshot (Standalone) - Dec'24 - QoQ
QoQ Growth in quarter ended Dec 2024 is 0.00% vs 0.00% in Sep 2024

QoQ Growth in quarter ended Dec 2024 is 63.16% vs -280.00% in Sep 2024
Half Yearly Results Snapshot (Standalone) - Sep'24
Growth in half year ended Sep 2024 is 0.00% vs 0.00% in Sep 2023

Growth in half year ended Sep 2024 is -380.00% vs 0.00% in Sep 2023
Nine Monthly Results Snapshot (Standalone) - Dec'24
YoY Growth in nine months ended Dec 2024 is 0.00% vs 0.00% in Dec 2023
YoY Growth in nine months ended Dec 2024 is -416.67% vs 25.00% in Dec 2023
Annual Results Snapshot (Standalone) - Mar'24
YoY Growth in year ended Mar 2024 is 0.00% vs 0.00% in Mar 2023
YoY Growth in year ended Mar 2024 is -45.45% vs 8.33% in Mar 2023
About Tricom Fruit Products Ltd

Company Coordinates


