Trigyn Techno.

  • Market Cap: Micro Cap
  • Industry: Computers - Software & Consulting
  • ISIN: INE948A01012
  • NSEID: TRIGYN
  • BSEID: 517562
INR
55.26
-0.25 (-0.45%)
BSENSE

Aug 19, 11:19 AM

BSE+NSE Vol: 3.54 k

  • Price Points
  • Score
  • Mojo Parameters
  • Total Return
  • News and Corporate Actions
  • Key factors
  • Shareholding
  • Financials
  • CompanyCV
stock-summaryPrice Point
High/Low

1Day

52 Week

Valuation
Technical
Day's Volume

CASH

3.54 k (-81.85%) Volume

Shareholding (Jun 2026)

FII

0.12%

Held by 2 FIIs

DII

0.01%

Held by 0 DIIs

Promoter

44.51%

Why is Trigyn Technologies Ltd falling/rising?

19-Aug-2026

As of 18-Aug, Trigyn Technologies Ltd's stock price is at 54.99, reflecting a decline of 1.63%. Despite a modest weekly increase of 3.02%, the stock has fallen 18.21% year-to-date and shows decreasing investor participation, indicating a longer-term bearish trend.

As of 18-Aug, Trigyn Technologies Ltd's stock price is falling, currently at 54.99, which reflects a decrease of 0.91 or 1.63%. The stock has been on a downward trend, having lost value for the last three consecutive days, resulting in a total decline of 2.01% during this period. Additionally, the stock's performance over the past week shows a modest increase of 3.02%, but this is overshadowed by its longer-term performance, with a year-to-date decline of 18.21% and a significant drop of 54.33% over the past three years.<BR><BR>Investor participation appears to be decreasing, as evidenced by a delivery volume of 15.06k on 17 August, which is down by 28.21% compared to the five-day average. This decline in trading activity may indicate a lack of confidence among investors. Although the stock's current price is higher than its 5-day, 20-day, 50-day, and 100-day moving averages, it remains lower than the 200-day moving average, suggesting a longer-term bearish trend. Overall, these factors contribute to the stock's current decline.

View full answer

Who are in the management team of Trigyn Techno.?

14-Aug-2026

The management team of Trigyn Technologies includes Chairman R. Ganapathi, CEO Dilip Hanumara, and several independent and executive directors, bringing diverse expertise to the company. Key members also include P Bhavana Rao, Mukesh Tank, and various independent directors.

The management team of Trigyn Technologies includes the following key individuals:<BR><BR>1. **R. Ganapathi** - Chairman (Non-Executive)<BR>2. **P Raja Mohan Rao** - Director<BR>3. **VENKATA CHERUKURI VARAPRASAD** - Independent Director<BR>4. **Vivek Khare** - Independent Director<BR>5. **B R Patil** - Independent Director<BR>6. **P Bhavana Rao** - Executive Director<BR>7. **A R Ansari** - Independent Director<BR>8. **K S Sripathi** - Independent Director<BR>9. **Mukesh Tank** - Company Secretary & Compliance Officer<BR>10. **Dilip Hanumara** - CEO & Director<BR>11. **Lakshmi Potluri** - Independent Director<BR><BR>This team brings a diverse range of expertise and leadership to the company.

View full answer

What does Trigyn Techno. do?

14-Aug-2026

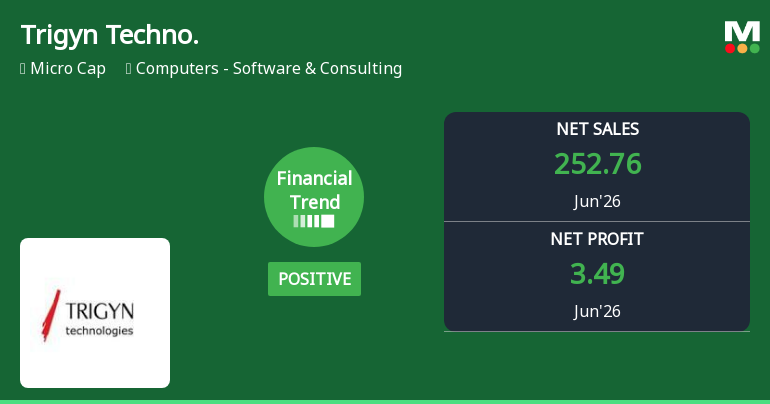
Trigyn Technologies Ltd is an IT company providing software and consulting services, established in 1986. As of June 2026, it reported net sales of 253 Cr and a net profit of 3 Cr, with a market cap of INR 175 Cr.

Overview:<BR>Trigyn Technologies Ltd is an IT company that provides IT solutions and services, operating within the Computers - Software & Consulting industry and classified as a Micro Cap.<BR><BR>History:<BR>Trigyn Technologies Ltd was established in 1986 and was initially known as Leading Edge Systems Limited. The company changed its name to Trigyn Technologies Limited in July 2001. The latest quarterly results reported net sales and net profit for June 2026.<BR><BR>Financial Snapshot:<BR>- Net Sales: 253 Cr (Quarterly Results - Jun 2026)<BR>- Net Profit: 3 Cr (Quarterly Results - Jun 2026)<BR>- Market Cap: INR 175 Cr (Micro Cap)<BR><BR>Key Metrics:<BR>- P/E: 16.00<BR>- Industry P/E: 22<BR>- Dividend Yield: 0.00%<BR>- Debt Equity: -0.58<BR>- Return on Equity: 0.38%<BR>- Price to Book: 0.22<BR><BR>Contact Details:<BR>Address: Unit 27 SDF-1 SEEPZ, Andheri (E) Mumbai Maharashtra : 400096<BR>Tel: 91-022-28290909/61400888<BR>Email: ro@trigyn.com<BR>Website: http://www.trigyn.com

View full answer

Who are the peers of the Trigyn Techno.?

14-Aug-2026

Trigyn Techno.'s peers include DRC Systems, Meta Infotech, DCM, Naapbooks, Dev Information, Shradha AI Tech, Enfuse Solutions, and Fidel Softech. Management risk varies from excellent to below average among peers, with Naapbooks showing the best growth and DRC Systems the lowest 1-year return at -25.29%, while Trigyn Techno. has a return of -26.96%.

Peers: The peers of Trigyn Techno. are DRC Systems, Meta Infotech, DCM, Naapbooks, Dev Information, Shradha AI Tech, Enfuse Solutions, and Fidel Softech.<BR><BR>Quality Snapshot: Excellent management risk is observed at DRC Systems, Naapbooks, and Fidel Softech, while Good management risk is found at Meta Infotech and the rest. Average management risk is present at Trigyn Techno., DCM, Dev Information, and Shradha AI Tech. Below Average management risk is noted at Enfuse Solutions. For growth, Excellent growth is seen at Naapbooks and Shradha AI Tech, Good growth is observed at Meta Infotech and Fidel Softech, while Average growth is found at DRC Systems, Trigyn Techno., DCM, Dev Information, and the rest. Below Average growth is noted at Enfuse Solutions. In terms of Capital Structure, Excellent is seen at DRC Systems, Meta Infotech, Trigyn Techno., Naapbooks, Shradha AI Tech, and Fidel Softech, while Average is found at DCM and Dev Information, and Good at Enfuse Solutions.<BR><BR>Return Snapshot: The peer with the highest 1-year return is Naapbooks with N/A, while the peer with the lowest is DRC Systems at -25.29%. Trigyn Techno.'s 1-year return is -26.96%, which is lower than DRC Systems. Additionally, the six-month returns are negative for DRC Systems, Trigyn Techno., DCM, Dev Information, Shradha AI Tech, and Enfuse Solutions.

View full answer

How big is Trigyn Techno.?

14-Aug-2026

As of 14th August, Trigyn Technologies Ltd has a market capitalization of 172.40 Cr, with recent net sales of 1004.69 Cr and a net profit of 10.08 Cr.

As of 14th August, Trigyn Technologies Ltd has a market capitalization of 172.40 Cr, categorized as a Micro Cap.<BR><BR>In the latest four quarters, Trigyn Technologies reported Net Sales of 1004.69 Cr and a Net Profit of 10.08 Cr.<BR><BR>The latest annual period for the balance sheet is March 2025, with Shareholder's Funds amounting to 741.06 Cr and Total Assets of 898.90 Cr.

View full answer

Should I buy, sell or hold Trigyn Technologies Ltd?

13-Aug-2026

When is the next results date for Trigyn Technologies Ltd?

05-Aug-2026

The next results date for Trigyn Technologies Ltd is 11 August 2026.

The next results date for Trigyn Technologies Ltd is scheduled for 11 August 2026.

View full answer

Are Trigyn Technologies Ltd latest results good or bad?

23-May-2026

Trigyn Technologies Ltd's latest results are concerning, showing a 75.39% decline in net profit despite a modest 5.13% increase in sales, indicating significant operational inefficiencies and heavy reliance on non-operating income. Overall, the financial performance is poor, raising red flags for investors.

Trigyn Technologies Ltd's latest results indicate a challenging financial situation. While the company reported net sales of ₹251.95 crores, reflecting a modest year-on-year growth of 5.13%, it struggled significantly with profitability. The operating profit margin, excluding other income, was just 1.42%, which highlights ongoing operational inefficiencies.<BR><BR>Most concerning is the drastic decline in net profit, which fell by 75.39% year-on-year to only ₹0.63 crores. This suggests that despite some revenue growth, the company is failing to convert that into meaningful profit. Additionally, a staggering 68.31% of profit before tax came from non-operating income, raising questions about the sustainability of its earnings.<BR><BR>The financial trajectory shows volatility, with a notable drop in net profit from ₹5.27 crores in the previous quarter to the current figure. This inconsistency, coupled with a return on equity of only 0.64%, signals serious concerns about the company's ability to generate adequate returns on capital.<BR><BR>Overall, the results can be characterized as poor, with significant red flags regarding profitability, operational efficiency, and reliance on non-core income. Investors may want to approach this company with caution given these challenges.

View full answer

Is Trigyn Techno. overvalued or undervalued?

18-Nov-2025

As of November 17, 2025, Trigyn Technologies is considered very expensive and overvalued with a high PE ratio of 47.41, negative EV to EBIT, and poor financial metrics, including a low ROE of 0.64% and a year-to-date stock performance lagging at -31.06% compared to the Sensex's 8.72%.

As of 17 November 2025, Trigyn Technologies has moved from an expensive to a very expensive valuation grade. The company is currently overvalued, as indicated by its high PE ratio of 47.41, a negative EV to EBIT of -144.39, and a PEG ratio of 0.00. In comparison, peers such as TCS and Infosys have significantly lower PE ratios of 22.32 and 22.23, respectively, highlighting the disparity in valuation.<BR><BR>Additionally, Trigyn's financial metrics show concerning trends, including a negative capital employed reflected in its ROCE and a low ROE of 0.64%. The company's recent stock performance has also lagged behind the Sensex, with a year-to-date return of -31.06% compared to the Sensex's 8.72%, further reinforcing the notion that Trigyn is not only overvalued but also struggling in the current market environment.

View full answer

How has been the historical performance of Trigyn Techno.?

13-Nov-2025

Trigyn Techno. has seen a significant decline in net sales and profits from Mar'24 to Mar'25, with net sales dropping to 894.41 Cr from 1,279.66 Cr, and profit after tax falling to 12.94 Cr from 19.96 Cr. Despite these declines, total assets and cash reserves increased during the same period.

Answer:<BR>The historical performance of Trigyn Techno. shows a significant decline in net sales and profits over the past few years, particularly from Mar'24 to Mar'25.<BR><BR>Breakdown:<BR>Trigyn Techno. reported net sales of 894.41 Cr in Mar'25, a notable decrease from 1,279.66 Cr in Mar'24 and 1,272.72 Cr in Mar'23. The total operating income followed a similar trend, dropping to 894.41 Cr in Mar'25 from 1,279.66 Cr in Mar'24. The company's total expenditure also decreased to 875.63 Cr in Mar'25 from 1,244.91 Cr in Mar'24, leading to an operating profit (PBDIT) of 36.52 Cr in Mar'25, down from 46.74 Cr in Mar'24. Profit before tax was reported at 27.56 Cr in Mar'25, compared to 38.21 Cr in Mar'24, while profit after tax fell to 12.94 Cr from 19.96 Cr in the previous year. The consolidated net profit also decreased to 11.77 Cr in Mar'25 from 19.96 Cr in Mar'24. Despite these declines, the company's total assets increased to 898.90 Cr in Mar'25 from 861.10 Cr in Mar'24, and total liabilities rose to 898.90 Cr from 861.10 Cr in the same period. Cash flow from operating activities was 51.00 Cr in Mar'25, down from 125.00 Cr in Mar'24, while the closing cash and cash equivalents increased to 413.00 Cr from 336.00 Cr. Overall, Trigyn Techno. has experienced a downward trend in sales and profits, despite a slight increase in total assets and cash reserves.

View full answer

Who are the top shareholders of the Trigyn Techno.?

17-Jul-2025

The top shareholders of Trigyn Techno are United Telecoms Limited with 44.51%, individual investors with 45.83%, and Vachan Kamath as the highest public shareholder at 1.42%. There are no pledged promoter holdings or mutual fund schemes associated with the company.

The top shareholders of Trigyn Techno include United Telecoms Limited, which holds the largest stake at 44.51%. Individual investors collectively own 45.83% of the company. Additionally, Vachan Kamath is noted as the highest public shareholder with a holding of 1.42%. There are also three foreign institutional investors (FIIs) that hold a combined total of 0.22%. Notably, there are no pledged promoter holdings or mutual fund schemes involved with the company.

View full answer

What is the technical trend for Trigyn Techno.?

09-Jun-2025

As of May 13, 2025, Trigyn Techno's technical trend is mildly bearish, influenced by mixed signals from MACD and KST across different time frames, with daily moving averages reinforcing a cautious outlook.

As of 13 May 2025, the technical trend for Trigyn Techno has changed from bearish to mildly bearish. The weekly MACD and KST indicate a mildly bullish stance, while the monthly MACD and KST are bearish, suggesting mixed signals across time frames. The daily moving averages are mildly bearish, reinforcing the overall cautious outlook. The Bollinger Bands show a mildly bullish trend on the weekly chart but bearish on the monthly. The Dow Theory indicates a mildly bullish trend on the weekly but no trend on the monthly. Overall, the current technical stance is mildly bearish, driven primarily by the daily moving averages and the mixed signals from the MACD and KST across different time frames.

View full answer

Has Trigyn Techno. declared dividend?

06-Jun-2025

Trigyn Technologies Ltd has declared a 2% dividend, amounting to 0.2 per share, with an ex-date of September 17, 2020. Despite this, the dividend yield is 0%, and total returns have shown significant negative performance in the short to medium term, with a recovery in the long-term.

Trigyn Technologies Ltd has declared a 2% dividend.<BR><BR>Dividend Details:<BR>- Percentage announced: 2%<BR>- Amount per share: 0.2<BR>- Ex-date: 17 Sep 2020<BR><BR>Dividend Yield: 0%<BR><BR>Total Returns by Period:<BR>In the 6-month period, the price return was -27.87%, the dividend return was 0%, resulting in a total return of -27.87%.<BR><BR>In the 1-year period, the price return was -27.3%, the dividend return was 0%, leading to a total return of -27.3%.<BR><BR>Over the 2-year period, the price return was -20.42%, the dividend return was 0%, which resulted in a total return of -20.42%.<BR><BR>In the 3-year period, the price return was -25.56%, the dividend return was 0%, culminating in a total return of -25.56%.<BR><BR>For the 4-year period, the price return was -29.65%, the dividend return was 0%, resulting in a total return of -29.65%.<BR><BR>Finally, in the 5-year period, the price return was 184.26%, the dividend return was 0.59%, leading to a total return of 184.85%.<BR><BR>Overall, while Trigyn Technologies Ltd did declare a dividend, the dividend yield remains at 0%, and the total returns over various periods indicate significant negative performance in the short to medium term, with a notable recovery in the long-term returns.

View full answer
iScoreScore
Click here to find our call on this stock
Strong Sell
Sell
Hold
Buy
Strong Buy

Dashboard

1

Poor long term growth as Operating profit has grown by an annual rate -40.27% of over the last 5 years

 
2

With ROE of 0.4, it has a Very Expensive valuation with a 0.2 Price to Book Value

3

Consistent Underperformance against the benchmark over the last 3 years

stock-summaryMojo Parameters

Mojo Parameters

Loading Valuation Snapshot...

Stock DNA

stock-summary
Industry

Computers - Software & Consulting

stock-summary
Market cap

INR 170 Cr (Micro Cap)

stock-summary
P/E

16.00

stock-summary
Industry P/E

21

stock-summary
Dividend Yield

0.00%

stock-summary
Debt Equity

-0.58

stock-summary
Return on Equity

0.38%

stock-summary
Price to Book

0.21

Revenue and Profits:
Net Sales:
253 Cr
(Quarterly Results - Jun 2026)
Net Profit:
3 Cr
stock-summaryTotal Returns
Total Returns (Price + Dividend) stock-summary
Dividend Yield (0%)
TimePeriod
Price Return
Dividend Return
Total Return
3 Months
0.44%
0%
0.44%
6 Months
-3.17%
0%
-3.17%
1 Year
-27.76%
0%
-27.76%
2 Years
-52.6%
0%
-52.6%
3 Years
-54.08%
0%
-54.08%
4 Years
-45.74%
0%
-45.74%
5 Years
-56.26%
0%
-56.26%

Latest dividend: 0.2 per share ex-dividend date: Sep-17-2020

Risk Adjusted Returns v/s stock-summary
Returns Beta
Icon
Beta has not been calculated since enough price history is not available
stock-summaryNews & Corporate Actions

Announcements stock-summary

Trigyn Technologies Limited - Clarification

18-Nov-2019 | Source : NSE

Trigyn Technologies Limited with respect to announcement dated 13-Nov-2019, regarding Appointment of CEO & Director of the Company. On basis of above the Company is required to clarify following: 1. Date of appointment/cessation (as applicable) & term of appointment

Trigyn Technologies Limited - Press Release

15-Nov-2019 | Source : NSE

Trigyn Technologies Limited has informed the Exchange regarding a press release dated November 15, 2019, titled "Trigyn Awarded Arlington County, Virginia IT Staff Augmentation Services Contract ".

Trigyn Technologies Limited - Press Release

14-Nov-2019 | Source : NSE

Trigyn Technologies Limited has informed the Exchange regarding a press release dated November 13, 2019, titled "TRIGYN TECHNOLOGIES LIMITED RESULTS HIGHLIGHTS FOR Q2 & HY-1 OF FY 2019-2020".

Corporate Actions stock-summary

stock-summary
BOARD MEETING

No Upcoming Board Meetings

stock-summary
DIVIDEND

Trigyn Technologies Ltd has declared 2% dividend, ex-date: 17 Sep 20

stock-summary
SPLITS

No Splits history available

stock-summary
BONUS

No Bonus history available

stock-summary
RIGHTS

No Rights history available

stock-summaryKey Factors

Quality key factors stock-summary

Factor
Value
Sales Growth (5y)
0.36%
EBIT Growth (5y)
-40.27%
EBIT to Interest (avg)
12.73
Debt to EBITDA (avg)
0.59
Net Debt to Equity (avg)
-0.58
Sales to Capital Employed (avg)
1.57
Tax Ratio
46.22%
Dividend Payout Ratio
0
Pledged Shares
0
Institutional Holding
0.13%
ROCE (avg)
7.79%
ROE (avg)
3.28%

Valuation key factors

Factor
Value
P/E Ratio
16
Industry P/E
21
Price to Book Value
0.21
EV to EBIT
-46.37
EV to EBITDA
-31.29
EV to Capital Employed
-0.88
EV to Sales
-0.29
PEG Ratio
NA
Dividend Yield
NA
ROCE (Latest)
Negative Capital Employed
ROE (Latest)
0.38%

Technicals key factors

Indicator
Weekly
Monthly
MACD
Mildly Bullish
Bearish
RSI
No Signal
No Signal
Bollinger Bands
Bearish
Mildly Bearish
Moving Averages
Mildly Bearish (Daily)
KST
Bearish
Bearish
Dow Theory
No Trend
No Trend
OBV
No Trend
Mildly Bullish
stock-summary Technical Indicator Scale: Bearish, Mildly Bearish, Sideways, Mildly Bullish, Bullish  Turned 
stock-summaryShareholding
Shareholding Snapshot : Jun 2026stock-summary
Shareholding Compare (%holding) stock-summary
Majority shareholders

Non Institution

Pledged Promoter Holdings

None

Mutual Funds

Held by 0 Schemes

FIIs

Held by 2 FIIs (0.12%)

Promoter with highest holding

United Telecoms Limited (44.51%)

Highest Public shareholder

Vachan Kamath (1.42%)

Individual Investors Holdings

46.21%

stock-summaryFinancial
[
  {
    "link": "quarterly",
    "btn_text": "All Quarterly Results",
    "header": "Quarterly Results Snapshot (Consolidated) - Jun'26 - QoQ",
    "rhs": [
      {
        "prefix": "Net Sales ",
        "suffix": "QoQ Growth in quarter ended Jun 2026 is 0.32% vs -2.36% in Mar 2026",
        "dir": 1
      },
      {
        "prefix": "Consolidated Net Profit ",
        "suffix": "QoQ Growth in quarter ended Jun 2026 is 453.97% vs -8.70% in Mar 2026",
        "dir": 1
      }
    ],
    "table": {
      "header": [
        "Jun'26",
        "Mar'26",
        "Change(%)"
      ],
      "body": [
        {
          "field": "Net Sales",
          "val1": "252.76",
          "val2": "251.95",
          "chgp": "0.32%",
          "chgp_class": "positive"
        },
        {
          "field": "Operating Profit (PBDIT) excl Other Income",
          "val1": "3.47",
          "val2": "3.59",
          "chgp": "-3.34%",
          "chgp_class": "negative"
        },
        {
          "field": "Interest",
          "val1": "0.89",
          "val2": "0.89",
          "chgp": "",
          "chgp_class": "neutral"
        },
        {
          "field": "Exceptional Items",
          "val1": "0.10",
          "val2": "-0.24",
          "chgp": "141.67%",
          "chgp_class": "positive"
        },
        {
          "field": "Consolidate Net Profit",
          "val1": "3.49",
          "val2": "0.63",
          "chgp": "453.97%",
          "chgp_class": "positive"
        },
        {
          "field": "Operating Profit Margin (Excl OI)",
          "val1": "1.37%",
          "val2": "1.42%",
          "chgp": "-0.05%",
          "chgp_class": "negative"
        }
      ]
    }
  },
  {
    "link": "half-yearly",
    "btn_text": "All Half Yearly Results",
    "header": "Half Yearly Results Snapshot (Consolidated) - Sep'25",
    "rhs": [
      {
        "prefix": "Net Sales ",
        "suffix": " Growth in half year ended Sep 2025 is 3.51% vs -29.44% in Sep 2024",
        "dir": 1
      },
      {
        "prefix": "Consolidated Net Profit ",
        "suffix": " Growth in half year ended Sep 2025 is -91.73% vs -65.23% in Sep 2024",
        "dir": -1
      }
    ],
    "table": {
      "header": [
        "Sep'25",
        "Sep'24",
        "Change(%)"
      ],
      "body": [
        {
          "field": "Net Sales",
          "val1": "466.45",
          "val2": "450.62",
          "chgp": "3.51%",
          "chgp_class": "positive"
        },
        {
          "field": "Operating Profit (PBDIT) excl Other Income",
          "val1": "-0.12",
          "val2": "14.11",
          "chgp": "-100.85%",
          "chgp_class": "negative"
        },
        {
          "field": "Interest",
          "val1": "1.17",
          "val2": "0.60",
          "chgp": "95.00%",
          "chgp_class": "negative"
        },
        {
          "field": "Exceptional Items",
          "val1": "-0.28",
          "val2": "-2.18",
          "chgp": "87.16%",
          "chgp_class": "positive"
        },
        {
          "field": "Consolidate Net Profit",
          "val1": "0.66",
          "val2": "7.98",
          "chgp": "-91.73%",
          "chgp_class": "negative"
        },
        {
          "field": "Operating Profit Margin (Excl OI)",
          "val1": "-0.03%",
          "val2": "3.13%",
          "chgp": "-3.16%",
          "chgp_class": "negative"
        }
      ]
    }
  },
  {
    "link": "nine-monthly",
    "btn_text": "All Nine Monthly Results",
    "header": "Nine Monthly Results Snapshot (Consolidated) - Dec'25",
    "rhs": [
      {
        "prefix": "Net Sales ",
        "suffix": "YoY Growth in nine months ended Dec 2025 is 10.20% vs -30.47% in Dec 2024",
        "dir": 1
      },
      {
        "prefix": "Consolidated Net Profit ",
        "suffix": "YoY Growth in nine months ended Dec 2025 is -85.34% vs 890.32% in Dec 2024",
        "dir": -1
      }
    ],
    "table": {
      "header": [
        "Dec'25",
        "Dec'24",
        "Change(%)"
      ],
      "body": [
        {
          "field": "Net Sales",
          "val1": "724.48",
          "val2": "657.40",
          "chgp": "10.20%",
          "chgp_class": "positive"
        },
        {
          "field": "Operating Profit (PBDIT) excl Other Income",
          "val1": "0.04",
          "val2": "13.48",
          "chgp": "-99.70%",
          "chgp_class": "negative"
        },
        {
          "field": "Interest",
          "val1": "1.63",
          "val2": "0.89",
          "chgp": "83.15%",
          "chgp_class": "negative"
        },
        {
          "field": "Exceptional Items",
          "val1": "-2.07",
          "val2": "-2.18",
          "chgp": "5.05%",
          "chgp_class": "positive"
        },
        {
          "field": "Consolidate Net Profit",
          "val1": "1.35",
          "val2": "9.21",
          "chgp": "-85.34%",
          "chgp_class": "negative"
        },
        {
          "field": "Operating Profit Margin (Excl OI)",
          "val1": "0.01%",
          "val2": "2.05%",
          "chgp": "-2.04%",
          "chgp_class": "negative"
        }
      ]
    }
  },
  {
    "link": "annual",
    "btn_text": "All Annual Results",
    "header": "Annual Results Snapshot (Consolidated) - Mar'26",
    "rhs": [
      {
        "prefix": "Net Sales ",
        "suffix": "YoY Growth in year ended Mar 2026 is 8.76% vs -29.84% in Mar 2025",
        "dir": 1
      },
      {
        "prefix": "Consolidated Net Profit ",
        "suffix": "YoY Growth in year ended Mar 2026 is -83.09% vs -41.03% in Mar 2025",
        "dir": -1
      }
    ],
    "table": {
      "header": [
        "Mar'26",
        "Mar'25",
        "Change(%)"
      ],
      "body": [
        {
          "field": "Net Sales",
          "val1": "976.43",
          "val2": "897.79",
          "chgp": "8.76%",
          "chgp_class": "positive"
        },
        {
          "field": "Operating Profit (PBDIT) excl Other Income",
          "val1": "3.63",
          "val2": "19.31",
          "chgp": "-81.20%",
          "chgp_class": "negative"
        },
        {
          "field": "Interest",
          "val1": "2.52",
          "val2": "2.77",
          "chgp": "-9.03%",
          "chgp_class": "positive"
        },
        {
          "field": "Exceptional Items",
          "val1": "-2.31",
          "val2": "-2.89",
          "chgp": "20.07%",
          "chgp_class": "positive"
        },
        {
          "field": "Consolidate Net Profit",
          "val1": "1.99",
          "val2": "11.77",
          "chgp": "-83.09%",
          "chgp_class": "negative"
        },
        {
          "field": "Operating Profit Margin (Excl OI)",
          "val1": "0.37%",
          "val2": "2.15%",
          "chgp": "-1.78%",
          "chgp_class": "negative"
        }
      ]
    }
  }
]

Quarterly Results Snapshot (Consolidated) - Jun'26 - QoQstock-summary

Jun'26
Mar'26
Change(%)
Net Sales
252.76
251.95
0.32%
Operating Profit (PBDIT) excl Other Income
3.47
3.59
-3.34%
Interest
0.89
0.89
Exceptional Items
0.10
-0.24
141.67%
Consolidate Net Profit
3.49
0.63
453.97%
Operating Profit Margin (Excl OI)
1.37%
1.42%
-0.05%
Values in Rs Cr.
Direction Arrows
Net Sales

QoQ Growth in quarter ended Jun 2026 is 0.32% vs -2.36% in Mar 2026

Direction Arrows
Consolidated Net Profit

QoQ Growth in quarter ended Jun 2026 is 453.97% vs -8.70% in Mar 2026

Half Yearly Results Snapshot (Consolidated) - Sep'25stock-summary

Sep'25
Sep'24
Change(%)
Net Sales
466.45
450.62
3.51%
Operating Profit (PBDIT) excl Other Income
-0.12
14.11
-100.85%
Interest
1.17
0.60
95.00%
Exceptional Items
-0.28
-2.18
87.16%
Consolidate Net Profit
0.66
7.98
-91.73%
Operating Profit Margin (Excl OI)
-0.03%
3.13%
-3.16%
Values in Rs Cr.
Direction Arrows
Net Sales

Growth in half year ended Sep 2025 is 3.51% vs -29.44% in Sep 2024

Direction Arrows
Consolidated Net Profit

Growth in half year ended Sep 2025 is -91.73% vs -65.23% in Sep 2024

Nine Monthly Results Snapshot (Consolidated) - Dec'25stock-summary

Dec'25
Dec'24
Change(%)
Net Sales
724.48
657.40
10.20%
Operating Profit (PBDIT) excl Other Income
0.04
13.48
-99.70%
Interest
1.63
0.89
83.15%
Exceptional Items
-2.07
-2.18
5.05%
Consolidate Net Profit
1.35
9.21
-85.34%
Operating Profit Margin (Excl OI)
0.01%
2.05%
-2.04%
Values in Rs Cr.
Direction Arrows
Net Sales

YoY Growth in nine months ended Dec 2025 is 10.20% vs -30.47% in Dec 2024

Direction Arrows
Consolidated Net Profit

YoY Growth in nine months ended Dec 2025 is -85.34% vs 890.32% in Dec 2024

Annual Results Snapshot (Consolidated) - Mar'26stock-summary

Mar'26
Mar'25
Change(%)
Net Sales
976.43
897.79
8.76%
Operating Profit (PBDIT) excl Other Income
3.63
19.31
-81.20%
Interest
2.52
2.77
-9.03%
Exceptional Items
-2.31
-2.89
20.07%
Consolidate Net Profit
1.99
11.77
-83.09%
Operating Profit Margin (Excl OI)
0.37%
2.15%
-1.78%
Values in Rs Cr.
Direction Arrows
Net Sales

YoY Growth in year ended Mar 2026 is 8.76% vs -29.84% in Mar 2025

Direction Arrows
Consolidated Net Profit

YoY Growth in year ended Mar 2026 is -83.09% vs -41.03% in Mar 2025

stock-summaryCompany CV
About Trigyn Technologies Ltd stock-summary
stock-summary
Trigyn Technologies Ltd
Micro Cap
Computers - Software & Consulting
Established by a group of software professionals in 1986, Trigyn Technologies Limited (TTL), earlier known as Leading Edge Systems Limited, a software house, started operations by providing turnkey software development and moved on to on-site software consultancy in year 1988. The Company's name was changed to 'Trigyn Technologies Limited' in July, 2001. Trigyn Technologies Limited is an IT Company providing IT solutions & services to its global clients.
Company Coordinates stock-summary
Company Details
Unit 27 SDF-1 SEEPZ, Andheri (E) Mumbai Maharashtra : 400096
stock-summary
Tel: 91-022-28290909/61400888
stock-summary
ro@trigyn.com
Registrar Details
Karvy Computershare Pvt Ltd., Karvy Selenium, Tower-B Plot No 31 & 32, Survey No 116/22, 115/24, 115/25, Financial District, Nanakramguda, Serilingampally, Mandal Ranga Reddy Dist, Hyderabad