
Compare TripAdvisor, Inc. with Similar Stocks
Stock DNA
Tour, Travel Related Services
USD 1,571 Million (Small Cap)
20.00
NA
0.00%
-0.04
17.61%
2.22
Total Returns (Price + Dividend) 
TripAdvisor, Inc. for the last several years.
Risk Adjusted Returns v/s
News

TripAdvisor, Inc. Experiences Evaluation Revision Amidst Competitive Market Challenges
TripAdvisor, Inc. has recently revised its evaluation amid fluctuating stock prices, with a 52-week range of $10.43 to $20.16. The company's performance has lagged behind the S&P 500, reflecting ongoing challenges in the competitive travel industry and underscoring the need for strategic initiatives to improve its market standing.
Read full news article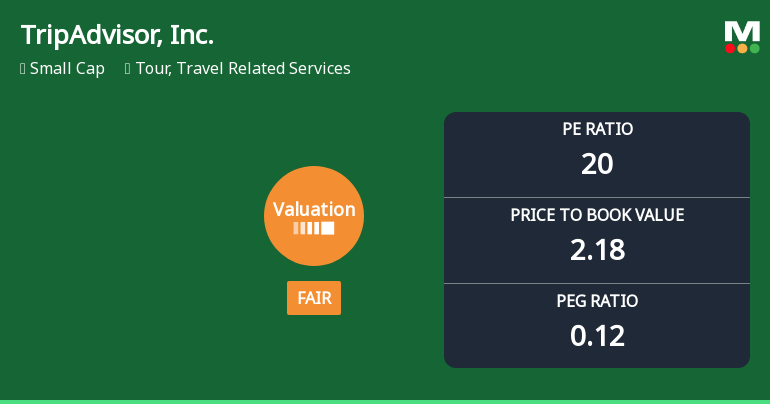
TripAdvisor, Inc. Experiences Revision in Its Stock Evaluation Amid Competitive Landscape
TripAdvisor, Inc. has recently adjusted its valuation, with current metrics indicating a P/E ratio of 20 and a return on equity of 10.65%. The company has faced challenges, reflected in a year-to-date return of 4.40% and a three-year decline of 35.21%, underperforming the S&P 500.
Read full news articleIs TripAdvisor, Inc. overvalued or undervalued?
As of 31 October 2025, the valuation grade for TripAdvisor, Inc. moved from expensive to fair. The company appears to be fairly valued based on its current metrics. Key ratios include a P/E ratio of 20, an EV to EBITDA of 9.55, and a PEG ratio of 0.12, indicating a potentially attractive growth relative to its price. In comparison to peers, TripAdvisor's P/E ratio of 21.23 is slightly higher than Service Corp. International at 21.11, while its EV to EBITDA is comparable to both TripAdvisor and its peer H&R Block, Inc. at 9.65. Despite this fair valuation, TripAdvisor has underperformed against the S&P 500 across multiple periods, with a YTD return of 0.27% compared to 16.30% for the index, and a 3-year return of -36.08% versus 76.66%....
Read full news article Announcements

Corporate Actions
Quality key factors
Valuation key factors
Technicals key factors
 Technical Indicator Scale: Bearish, Mildly Bearish, Sideways, Mildly Bullish, Bullish Turned
 Shareholding Snapshot : Sep 2025
Shareholding Compare (%holding)
Domestic Funds
Held in 75 Schemes (46.46%)
Held by 153 Foreign Institutions (20.62%)
Quarterly Results Snapshot (Consolidated) - Jun'25 - YoY

YoY Growth in quarter ended Jun 2025 is 6.44% vs 0.61% in Jun 2024
YoY Growth in quarter ended Jun 2025 is 50.00% vs 0.00% in Jun 2024
Annual Results Snapshot (Consolidated) - Dec'24

YoY Growth in year ended Dec 2024 is 2.63% vs 19.84% in Dec 2023
YoY Growth in year ended Dec 2024 is -50.00% vs -50.00% in Dec 2023
About TripAdvisor, Inc.

Company Coordinates


