
Compare Trishakti Indus with Similar Stocks
Dashboard
Strong Long Term Fundamental Strength with an average Return on Equity (ROE) of 15.14%
Healthy long term growth as Operating profit has grown by an annual rate of 139.75%
With a growth in Operating Profit of 40.76%, the company declared Very Positive results in Mar 26
With ROE of 16.7, it has a Very Expensive valuation with a 5.8 Price to Book Value
Majority shareholders : Promoters
Stock DNA
Non Banking Financial Company (NBFC)
INR 259 Cr (Micro Cap)
34.00
20
0.00%
1.91
16.71%
5.72
Total Returns (Price + Dividend) 
Latest dividend: 0.14 per share ex-dividend date: Sep-17-2024
Risk Adjusted Returns v/s
Returns Beta

News

Trishakti Industries Ltd Downgraded to Hold Amid Mixed Technical and Valuation Signals
Trishakti Industries Ltd, a micro-cap player in the Non Banking Financial Company (NBFC) sector, has seen its investment rating downgraded from Buy to Hold as of 8 June 2026. This adjustment reflects a nuanced reassessment across four key parameters: quality, valuation, financial trend, and technicals, amid a backdrop of strong long-term fundamentals but mixed short-term signals.
Read full news article
Trishakti Industries Ltd Upgraded to Buy on Strong Technical and Financial Performance
Trishakti Industries Ltd, a micro-cap player in the Non Banking Financial Company (NBFC) sector, has seen its investment rating upgraded from Hold to Buy as of 2 June 2026. This upgrade reflects a comprehensive reassessment across four critical parameters: quality, valuation, financial trend, and technicals. The company’s recent robust financial performance, coupled with a stabilising technical outlook, has prompted this positive revision despite some valuation concerns.
Read full news article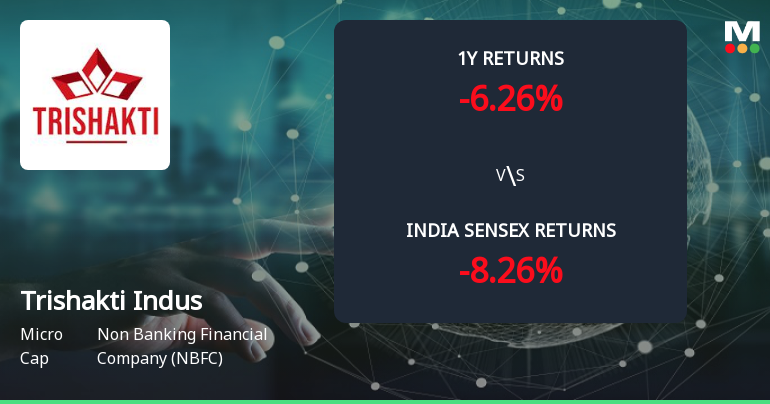
Golden Cross Forms in Trishakti Industries Ltd — On a Day the Stock Fell 1.12%. What the Mixed Signals Mean
The 50-day moving average has crossed above the 200-day moving average for Trishakti Industries Ltd, signalling a golden cross on 2 Jun 2026. Yet, the stock declined 1.12% on the day this technical event occurred, while monthly momentum indicators remain mildly bearish. This juxtaposition of signals calls for a detailed examination of whether the golden cross is a reliable indicator or a misleading signal in this context.
Read full news article Announcements
Announcement under Regulation 30 (LODR)-Newspaper Publication
09-Jun-2026 | Source : BSEPlease find enclosed Newspaper Publication with respect to Special Window for Transfer and Dematerialization of Physical Securities.
Announcement under Regulation 30 (LODR)-Press Release / Media Release
01-Jun-2026 | Source : BSEPress Release on Strategic Entry into EV Machinery Segment.
Compliances-Reg.24(A)-Annual Secretarial Compliance
30-May-2026 | Source : BSEPursuant to Regulation 24A of the SEBI (Listing Obligations & Disclosure Requirements) Regulations 2015 we are enclosing herewith the Annual Secretarial Compliance Report for the financial year ended March 2026.
Corporate Actions

No Upcoming Board Meetings

Trishakti Industries Ltd has declared 7% dividend, ex-date: 17 Sep 24

Trishakti Industries Ltd has announced 2:10 stock split, ex-date: 16 Jan 24

No Bonus history available

No Rights history available
Quality key factors
Valuation key factors
Technicals key factors
 Technical Indicator Scale: Bearish, Mildly Bearish, Sideways, Mildly Bullish, Bullish Turned
 Shareholding Snapshot : Mar 2026
Shareholding Compare (%holding)
Promoters
None
Held by 0 Schemes
Held by 0 FIIs
Suresh Jhanwar (24.81%)
Kred Hospitality Llp (1.27%)
20.65%
Quarterly Results Snapshot (Consolidated) - Mar'26 - QoQ

QoQ Growth in quarter ended Mar 2026 is 13.87% vs 20.30% in Dec 2025
QoQ Growth in quarter ended Mar 2026 is 6.64% vs 51.57% in Dec 2025
Half Yearly Results Snapshot (Consolidated) - Sep'25

Growth in half year ended Sep 2025 is -24.75% vs -69.30% in Sep 2024
Growth in half year ended Sep 2025 is 10.71% vs 873.91% in Sep 2024
Nine Monthly Results Snapshot (Consolidated) - Dec'25
YoY Growth in nine months ended Dec 2025 is 18.32% vs -79.91% in Dec 2024
YoY Growth in nine months ended Dec 2025 is 116.37% vs 370.83% in Dec 2024
Annual Results Snapshot (Consolidated) - Mar'26
YoY Growth in year ended Mar 2026 is 63.63% vs -87.36% in Mar 2025
YoY Growth in year ended Mar 2026 is 109.83% vs 415.94% in Mar 2025
About Trishakti Industries Ltd

Company Coordinates


