Triveni Glass

  • Market Cap: Micro Cap
  • Industry: Miscellaneous
  • ISIN: INE094C01011
  • NSEID:
  • BSEID: 502281
INR
7.01
-0.29 (-3.97%)
BSENSE

Aug 07, 03:30 PM

BSE+NSE Vol: 6329

  • Price Points
  • Score
  • Mojo Parameters
  • Total Return
  • News and Corporate Actions
  • Key factors
  • Shareholding
  • Financials
  • CompanyCV
stock-summaryPrice Point
High/Low

1Day

52 Week

Valuation
Technical
Day's Volume

CASH

6.33 k (-16.31%) Volume

Shareholding (Jun 2026)

FII

2.76%

Held by 1 FIIs

DII

3.47%

Held by 1 DIIs

Promoter

5.46%

Why is Triveni Glass Ltd falling/rising?

10-Aug-2026

As of 09-Aug, Triveni Glass Ltd's stock price is at 7.01, reflecting a 3.97% decrease and a significant decline of 33.24% over the last eight days. The stock has underperformed its sector and the benchmark Sensex, with a year-to-date drop of 24.54% and a yearly decline of 47.92%.

As of 09-Aug, Triveni Glass Ltd's stock price is falling, currently at 7.01, which reflects a decrease of 0.29 or 3.97%. The stock has been on a downward trend, having lost value for the last eight consecutive days, resulting in a significant decline of 33.24% over this period. <BR><BR>In terms of performance relative to the market, the stock has underperformed its sector by 2.45% today. Over the past week, it has seen a substantial drop of 20.70%, while the benchmark Sensex has only increased by 0.52%. Year-to-date, the stock is down 24.54%, significantly worse than the Sensex's decline of 7.89%. Over the past year, Triveni Glass Ltd has experienced a staggering 47.92% decrease, compared to a much smaller decline of 2.63% in the Sensex.<BR><BR>Additionally, there has been a notable decrease in investor participation, with delivery volume dropping by 76.27% against the five-day average, indicating reduced interest in trading the stock. Although the stock's price is higher than the 50-day and 100-day moving averages, it remains lower than the 5-day, 20-day, and 200-day moving averages, which suggests a bearish trend. Overall, these factors contribute to the ongoing decline in Triveni Glass Ltd's stock price.

View full answer

Are Triveni Glass Ltd latest results good or bad?

29-Jul-2026

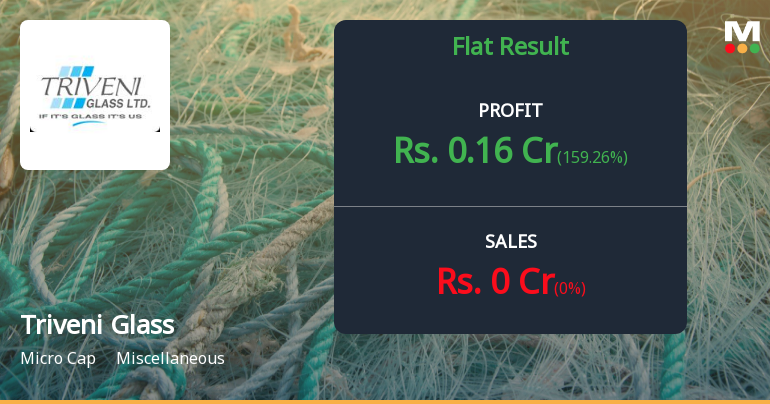
Triveni Glass Ltd's latest results are concerning, showing a net profit of ₹0.16 crores due to a 369% increase in other income, but the company has not generated sales for seven quarters and has a negative book value of ₹-11.66 per share. Overall, the financial distress and reliance on non-operating income indicate a risky investment with no clear recovery path.

Triveni Glass Ltd's latest results present a concerning picture overall. While the company reported a net profit of ₹0.16 crores in Q1 FY27, marking its first profit in five quarters, this is largely attributed to a significant increase in other income, which surged by 369% year-on-year. However, the company has not generated any sales for at least seven consecutive quarters, indicating a complete cessation of its manufacturing operations.<BR><BR>The financial health of Triveni Glass is quite troubling, with a negative book value of ₹-11.66 per share and a market capitalization of only ₹12 crores. The company has effectively become a shell entity, reliant on non-operating income rather than any sustainable business operations. The operating losses have widened, and the balance sheet shows severe distress, with liabilities exceeding assets.<BR><BR>In summary, despite a brief moment of profitability, the underlying operational issues and financial distress suggest that the results are not good. The company is in a critical state, with no clear path to recovery, making it a risky investment.

View full answer

Should I buy, sell or hold Triveni Glass Ltd?

29-Jul-2026

When is the next results date for Triveni Glass Ltd?

24-Jul-2026

The next results date for Triveni Glass Ltd is 28 July 2026.

The next results date for Triveni Glass Ltd is scheduled for 28 July 2026.

View full answer

How big is Triveni Glass?

11-Jun-2026

As of 10th June, Triveni Glass Ltd has a market capitalization of 8.00 Cr, with net sales of 0.00 Cr and a net profit loss of 0.75 Cr in the latest four quarters. The balance sheet for March 2025 shows shareholder's funds at a loss of 14.72 Cr and total assets valued at 6.58 Cr.

As of 10th June, Triveni Glass Ltd has a market capitalization of 8.00 Cr, categorizing it as a Micro Cap company.<BR><BR>In the latest four quarters, Triveni Glass reported net sales of 0.00 Cr and a net profit loss of 0.75 Cr.<BR><BR>The latest annual period for the balance sheet is March 2025, showing shareholder's funds at a loss of 14.72 Cr and total assets valued at 6.58 Cr.

View full answer

Who are in the management team of Triveni Glass?

11-Jun-2026

The management team of Triveni Glass includes J K Agrawal (Executive Director & Managing Director), A K Dhawan (Executive Director, Finance & CFO), and four Independent Non-Executive Directors: Ishwar Chandra Aga, Abhishek Jain, Piyush Kesarwani, and Manju Agarwal.

The management team of Triveni Glass includes the following individuals:<BR><BR>1. J K Agrawal - Executive Director & Managing Director<BR>2. A K Dhawan - Executive Director (Finance) & Chief Financial Officer<BR>3. Ishwar Chandra Aga - Independent Non-Executive Director<BR>4. Abhishek Jain - Independent Non-Executive Director<BR>5. Piyush Kesarwani - Independent Non-Executive Director<BR>6. Manju Agarwal - Independent Non-Executive Director<BR><BR>If you need more information about their roles or the company, feel free to ask!

View full answer

Who are the peers of the Triveni Glass?

11-Jun-2026

Triveni Glass's peers include Reetech Intl, Milestone Global, Mayur Floorings, Gala Global, Kabra Commercial, Jain Marmo Inds, CHD Chemicals, Patron Exim, Winny Immigratio, and Rite Zone. Most peers exhibit below-average management risk and growth, with Mayur Floorings showing the highest 1-year return at 25.44% and Patron Exim the lowest at -62.09%.

Peers: The peers of Triveni Glass are Reetech Intl, Milestone Global, Mayur Floorings, Gala Global, Kabra Commercial, Jain Marmo Inds, CHD Chemicals, Patron Exim, Winny Immigratio, and Rite Zone.<BR><BR>Quality Snapshot: Below Average management risk is observed at Reetech Intl, Milestone Global, Mayur Floorings, Gala Global, Kabra Commercial, CHD Chemicals, Patron Exim, and Winny Immigratio, while Average management risk is found at Jain Marmo Inds. All peers except Jain Marmo Inds have Below Average growth, while Jain Marmo Inds has Average growth. Capital Structure ratings show that Jain Marmo Inds has Average capital structure, while the rest have Below Average.<BR><BR>Return Snapshot: Mayur Floorings has the highest 1-year return at 25.44%, while Patron Exim has the lowest at -62.09%. Triveni Glass's 1-year return of -52.94% is worse than Mayur Floorings but better than Patron Exim. Additionally, the six-month return is negative for Reetech Intl, Milestone Global, Gala Global, Patron Exim, and Winny Immigratio.

View full answer

What does Triveni Glass do?

10-Jun-2026

Triveni Glass Ltd, established in 1956, specializes in manufacturing laminated safety glass and other glass products. It is a micro-cap company with a market cap of INR 8 Cr and reported a net profit of 0 Cr for March 2026.

Overview: <BR>Triveni Glass Ltd is a pioneer in the manufacturing of laminated safety glass and other glass products within the miscellaneous industry, categorized as a micro-cap company.<BR><BR>History: <BR>Triveni Glass Ltd was established in 1956 by the late Mr. D. N. Agrawal, who introduced the first technology in India for manufacturing laminated safety glass for automobiles. The company has since expanded its product offerings to include tempered glass and mirrors. The latest quarterly results reported are for March 2026.<BR><BR>Financial Snapshot: <BR>Most recent Net Sales: N/A <BR>Most recent Net Profit: 0 Cr (Quarterly Results - Mar 2026) <BR>Market-cap value: INR 8 Cr (Micro Cap)<BR><BR>Key Metrics: <BR>P/E: N/A <BR>Industry P/E: 37 <BR>Dividend Yield: 0.00% <BR>Debt Equity: -1.18 <BR>Return on Equity: 4.85% <BR>Price to Book: -0.54<BR><BR>Contact Details: <BR>Address: 1 Kanpur Road, Allahabad Uttar Pradesh: 211001 <BR>Phone: 91-0532-2407325 <BR>Email: akd@triveniglassltd.com <BR>Website: http://www.triveniglassltd.com

View full answer

How has been the historical performance of Triveni Glass?

01-Nov-2025

Triveni Glass has experienced a significant decline in financial performance, with net sales dropping from 59.26 crore in March 2020 to zero by March 2025, alongside negative operating profit and cash flow. Total liabilities and assets also decreased substantially during this period, indicating a deterioration in financial health.

Answer:<BR>The historical performance of Triveni Glass shows a significant decline in financial metrics over the years, particularly from March 2020 onwards. <BR><BR>Breakdown:<BR>Triveni Glass reported net sales of 59.26 crore in March 2020, which decreased to zero by March 2025, indicating a complete halt in revenue generation. The total operating income followed a similar trend, starting at 59.26 crore in March 2020 and dropping to zero by March 2025. The company's expenditure also decreased significantly, from 60.65 crore in March 2020 to 0.87 crore in March 2025. Operating profit fluctuated, with a peak of 6.47 crore in March 2019, but turned negative in subsequent years, culminating in a profit before tax of only 0.09 crore in March 2025. The profit after tax mirrored this decline, falling from 16.77 crore in March 2020 to just 0.09 crore in March 2025. The company's total liabilities decreased from 71.85 crore in March 2020 to 6.58 crore in March 2025, while total assets also saw a decline from 71.85 crore to 6.58 crore in the same period. Cash flow from operating activities remained negative for several years, with no cash inflow recorded from March 2022 to March 2025. Overall, Triveni Glass has experienced a substantial deterioration in its financial health over the past few years.

View full answer

Is Triveni Glass overvalued or undervalued?

09-Jun-2025

As of April 25, 2023, Triveni Glass is considered risky and overvalued with a PE ratio of 18.03 and negative returns on capital, underperforming the Sensex with a -31.87% return over the past year.

As of 25 April 2023, the valuation grade for Triveni Glass has moved from does not qualify to risky, indicating a shift in perception regarding its financial health. The company is currently assessed as overvalued based on its financial ratios, with a PE ratio of 18.03, an EV to EBIT of -29.23, and a ROCE of -32.98%. These figures suggest significant underlying issues, particularly the negative returns on capital employed.<BR><BR>In comparison to its peers, Triveni Glass's valuation appears unfavorable. For instance, Asahi India Glass is categorized as expensive with a PE ratio of 51.96, while Empire Industries is considered attractive with a PE of 18.98. The stark contrast in valuations highlights Triveni's challenges in generating positive returns and sustaining investor confidence. Additionally, the company's stock has underperformed against the Sensex over the past year, with a return of -31.87% compared to the Sensex's 7.62%, further reinforcing the notion that Triveni Glass is overvalued in its current state.

View full answer

What is the technical trend for Triveni Glass?

09-Jun-2025

As of May 13, 2025, Triveni Glass shows a mildly bearish trend, with mixed signals from the MACD and KST indicators, while moving averages and Bollinger Bands confirm the bearish outlook.

As of 13 May 2025, the technical trend for Triveni Glass has changed from bearish to mildly bearish. The weekly MACD indicates a mildly bullish stance, while the monthly MACD remains bearish, suggesting mixed signals. The Bollinger Bands and moving averages on the weekly and daily time frames are all indicating mildly bearish conditions. The KST shows a mildly bullish reading on the weekly but bearish on the monthly, further contributing to the mixed outlook. Overall, the current technical stance is mildly bearish, driven primarily by the moving averages and Bollinger Bands.

View full answer

Who are the top shareholders of the Triveni Glass?

06-Jun-2025

The top shareholders of Triveni Glass include Jitendra Kumar Agrawal with 2.0%, Tecknopoint Mercantile Co Private Limited with 4.59%, and individual investors holding 67.04%. Additionally, there is one foreign institutional investor with 2.76% and four mutual fund schemes with a combined 0.05%, with no pledged promoter holdings.

The top shareholders of Triveni Glass include a mix of individual and institutional investors. The largest individual shareholder is Jitendra Kumar Agrawal, holding 2.0% of the shares. The highest public shareholder is Tecknopoint Mercantile Co Private Limited, which holds 4.59%. Additionally, individual investors collectively hold a significant portion, accounting for 67.04% of the shares. On the institutional side, there is one foreign institutional investor (FII) with a holding of 2.76%, and four mutual fund schemes that together hold 0.05%. Notably, there are no pledged promoter holdings in the company.

View full answer

Has Triveni Glass declared dividend?

06-Jun-2025

No Dividend History Available

iScoreScore
Click here to find our call on this stock
Strong Sell
Sell
Hold
Buy
Strong Buy

Dashboard

1

With a Negative Book Value, the company has a Weak Long Term Fundamental Strength

  • Poor long term growth as Net Sales has grown by an annual rate of 0% and Operating profit at 0% over the last 5 years
  • The company has a negative book value of Rs 15.46 crore
2

Flat results in Jun 26

3

Risky - Negative EBITDA

4

Consistent Underperformance against the benchmark over the last 3 years

stock-summaryMojo Parameters

Mojo Parameters

Loading Valuation Snapshot...

Stock DNA

stock-summary
Industry

Miscellaneous

stock-summary
Market cap

INR 9 Cr (Micro Cap)

stock-summary
P/E

NA (Loss Making)

stock-summary
Industry P/E

34

stock-summary
Dividend Yield

0.00%

stock-summary
Debt Equity

-1.18

stock-summary
Return on Equity

3.36%

stock-summary
Price to Book

-0.60

Revenue and Profits:
Net Sales:
(Quarterly Results - Jun 2026)
Net Profit:
0 Cr
stock-summaryTotal Returns
Total Returns (Price + Dividend) stock-summary
Dividend Yield (0%)
TimePeriod
Price Return
Dividend Return
Total Return
3 Months
0.29%
0%
0.29%
6 Months
-10.24%
0%
-10.24%
1 Year
-47.92%
0%
-47.92%
2 Years
-67.12%
0%
-67.12%
3 Years
-60.77%
0%
-60.77%
4 Years
-68.06%
0%
-68.06%
5 Years
8.68%
0%
8.68%

Triveni Glass for the last several years.

Risk Adjusted Returns v/s stock-summary
Returns Beta
Icon
Beta has not been calculated since enough price history is not available
stock-summaryNews & Corporate Actions

Announcements stock-summary

Publication On Unaudited Financials In Newspaper.

30-Jul-2026 | Source : BSE

The unaudited financial results for june 2026 are published in two newspapers today i.e on 30.07.2026

Announcement under Regulation 30 (LODR)-Newspaper Publication

30-Jul-2026 | Source : BSE

The unaudited financial results for the quarter ended 30.06.2026 are published in two newspapers on 30.07.2026 .

Disclosure Under Regulation 30 Of SEBI(LODR) 2015 Ref: Triveni Glass Limited (Scrip Code : 502281

28-Jul-2026 | Source : BSE

The board has approved name deletion and issuance of shares in the name of Jitendra Kumar Agrawal in respect of 18000 equity shares of the company under folio no 07A00009 which were held jointly by him with his deceased parents.

Corporate Actions stock-summary

stock-summary
BOARD MEETING

No Upcoming Board Meetings

stock-summary
DIVIDEND

No Dividend history available

stock-summary
SPLITS

No Splits history available

stock-summary
BONUS

No Bonus history available

stock-summary
RIGHTS

No Rights history available

stock-summaryKey Factors

Quality key factors stock-summary

Factor
Value
Sales Growth (5y)
0
EBIT Growth (5y)
-12.26%
EBIT to Interest (avg)
0
Debt to EBITDA (avg)
Negative Net Debt
Net Debt to Equity (avg)
-1.18
Sales to Capital Employed (avg)
0
Tax Ratio
Tax Ratio is Negative%
Dividend Payout Ratio
0
Pledged Shares
0
Institutional Holding
6.22%
ROCE (avg)
-37.13%
ROE (avg)
0

Valuation key factors

Factor
Value
P/E Ratio
NA (Loss Making)
Industry P/E
34
Price to Book Value
-0.57
EV to EBIT
-19.63
EV to EBITDA
-20.22
EV to Capital Employed
9.71
EV to Sales
NA
PEG Ratio
NA
Dividend Yield
NA
ROCE (Latest)
-40.50%
ROE (Latest)
Negative BV

Technicals key factors

Indicator
Weekly
Monthly
MACD
Mildly Bullish
Bearish
RSI
No Signal
No Signal
Bollinger Bands
Mildly Bullish
Bearish
Moving Averages
Mildly Bearish (Daily)
KST
Mildly Bullish
Bearish
Dow Theory
Mildly Bullish
No Trend
stock-summary Technical Indicator Scale: Bearish, Mildly Bearish, Sideways, Mildly Bullish, Bullish  Turned 
stock-summaryShareholding
Shareholding Snapshot : Jun 2026stock-summary
Shareholding Compare (%holding) stock-summary
Majority shareholders

Non Institution

Pledged Promoter Holdings

None

Mutual Funds

Held by 4 Schemes (0.05%)

FIIs

Held by 1 FIIs (2.76%)

Promoter with highest holding

Jitendra Kumar Agrawal (2.0%)

Highest Public shareholder

Mahendra Girdharilal (4.14%)

Individual Investors Holdings

66.83%

stock-summaryFinancial
[
  {
    "link": "quarterly",
    "btn_text": "All Quarterly Results",
    "header": "Quarterly Results Snapshot (Standalone) - Jun'26 - QoQ",
    "rhs": [
      {
        "prefix": "Net Sales ",
        "suffix": "QoQ Growth in quarter ended Jun 2026 is 0.00% vs 0.00% in Mar 2026",
        "dir": 0
      },
      {
        "prefix": "Standalone Net Profit ",
        "suffix": "QoQ Growth in quarter ended Jun 2026 is 159.26% vs -58.82% in Mar 2026",
        "dir": 1
      }
    ],
    "table": {
      "header": [
        "Jun'26",
        "Mar'26",
        "Change(%)"
      ],
      "body": [
        {
          "field": "Net Sales",
          "val1": "0.00",
          "val2": "0.00",
          "chgp": "",
          "chgp_class": "neutral"
        },
        {
          "field": "Operating Profit (PBDIT) excl Other Income",
          "val1": "-0.44",
          "val2": "-0.36",
          "chgp": "-22.22%",
          "chgp_class": "negative"
        },
        {
          "field": "Interest",
          "val1": "0.00",
          "val2": "0.00",
          "chgp": "",
          "chgp_class": "neutral"
        },
        {
          "field": "Exceptional Items",
          "val1": "0.00",
          "val2": "0.00",
          "chgp": "",
          "chgp_class": "neutral"
        },
        {
          "field": "Standalone Net Profit",
          "val1": "0.16",
          "val2": "-0.27",
          "chgp": "159.26%",
          "chgp_class": "positive"
        },
        {
          "field": "Operating Profit Margin (Excl OI)",
          "val1": "0.00%",
          "val2": "0.00%",
          "chgp": "NA",
          "chgp_class": "neutral"
        }
      ]
    }
  },
  {
    "link": "half-yearly",
    "btn_text": "All Half Yearly Results",
    "header": "Half Yearly Results Snapshot (Standalone) - Sep'25",
    "rhs": [
      {
        "prefix": "Net Sales ",
        "suffix": " Growth in half year ended Sep 2025 is 0.00% vs 0.00% in Sep 2024",
        "dir": 0
      },
      {
        "prefix": "Standalone Net Profit ",
        "suffix": " Growth in half year ended Sep 2025 is -196.88% vs -76.12% in Sep 2024",
        "dir": -1
      }
    ],
    "table": {
      "header": [
        "Sep'25",
        "Sep'24",
        "Change(%)"
      ],
      "body": [
        {
          "field": "Net Sales",
          "val1": "0.00",
          "val2": "0.00",
          "chgp": "",
          "chgp_class": "neutral"
        },
        {
          "field": "Operating Profit (PBDIT) excl Other Income",
          "val1": "-0.50",
          "val2": "-0.39",
          "chgp": "-28.21%",
          "chgp_class": "negative"
        },
        {
          "field": "Interest",
          "val1": "0.00",
          "val2": "0.00",
          "chgp": "",
          "chgp_class": "neutral"
        },
        {
          "field": "Exceptional Items",
          "val1": "0.00",
          "val2": "0.00",
          "chgp": "",
          "chgp_class": "neutral"
        },
        {
          "field": "Standalone Net Profit",
          "val1": "-0.31",
          "val2": "0.32",
          "chgp": "-196.88%",
          "chgp_class": "negative"
        },
        {
          "field": "Operating Profit Margin (Excl OI)",
          "val1": "0.00%",
          "val2": "0.00%",
          "chgp": "NA",
          "chgp_class": "neutral"
        }
      ]
    }
  },
  {
    "link": "nine-monthly",
    "btn_text": "All Nine Monthly Results",
    "header": "Nine Monthly Results Snapshot (Standalone) - Dec'25",
    "rhs": [
      {
        "prefix": "Net Sales ",
        "suffix": "YoY Growth in nine months ended Dec 2025 is 0.00% vs 0.00% in Dec 2024",
        "dir": 0
      },
      {
        "prefix": "Standalone Net Profit ",
        "suffix": "YoY Growth in nine months ended Dec 2025 is -308.70% vs -84.67% in Dec 2024",
        "dir": -1
      }
    ],
    "table": {
      "header": [
        "Dec'25",
        "Dec'24",
        "Change(%)"
      ],
      "body": [
        {
          "field": "Net Sales",
          "val1": "0.00",
          "val2": "0.00",
          "chgp": "",
          "chgp_class": "neutral"
        },
        {
          "field": "Operating Profit (PBDIT) excl Other Income",
          "val1": "-0.73",
          "val2": "-0.61",
          "chgp": "-19.67%",
          "chgp_class": "negative"
        },
        {
          "field": "Interest",
          "val1": "0.00",
          "val2": "0.00",
          "chgp": "",
          "chgp_class": "neutral"
        },
        {
          "field": "Exceptional Items",
          "val1": "0.00",
          "val2": "0.00",
          "chgp": "",
          "chgp_class": "neutral"
        },
        {
          "field": "Standalone Net Profit",
          "val1": "-0.48",
          "val2": "0.23",
          "chgp": "-308.70%",
          "chgp_class": "negative"
        },
        {
          "field": "Operating Profit Margin (Excl OI)",
          "val1": "0.00%",
          "val2": "0.00%",
          "chgp": "NA",
          "chgp_class": "neutral"
        }
      ]
    }
  },
  {
    "link": "annual",
    "btn_text": "All Annual Results",
    "header": "Annual Results Snapshot (Standalone) - Mar'26",
    "rhs": [
      {
        "prefix": "Net Sales ",
        "suffix": "YoY Growth in year ended Mar 2026 is 0.00% vs 0.00% in Mar 2025",
        "dir": 0
      },
      {
        "prefix": "Standalone Net Profit ",
        "suffix": "YoY Growth in year ended Mar 2026 is -933.33% vs -96.86% in Mar 2025",
        "dir": -1
      }
    ],
    "table": {
      "header": [
        "Mar'26",
        "Mar'25",
        "Change(%)"
      ],
      "body": [
        {
          "field": "Net Sales",
          "val1": "0.00",
          "val2": "0.00",
          "chgp": "",
          "chgp_class": "neutral"
        },
        {
          "field": "Operating Profit (PBDIT) excl Other Income",
          "val1": "-1.09",
          "val2": "-0.87",
          "chgp": "-25.29%",
          "chgp_class": "negative"
        },
        {
          "field": "Interest",
          "val1": "0.00",
          "val2": "0.00",
          "chgp": "",
          "chgp_class": "neutral"
        },
        {
          "field": "Exceptional Items",
          "val1": "0.00",
          "val2": "0.00",
          "chgp": "",
          "chgp_class": "neutral"
        },
        {
          "field": "Standalone Net Profit",
          "val1": "-0.75",
          "val2": "0.09",
          "chgp": "-933.33%",
          "chgp_class": "negative"
        },
        {
          "field": "Operating Profit Margin (Excl OI)",
          "val1": "0.00%",
          "val2": "0.00%",
          "chgp": "NA",
          "chgp_class": "neutral"
        }
      ]
    }
  }
]

Quarterly Results Snapshot (Standalone) - Jun'26 - QoQstock-summary

Jun'26
Mar'26
Change(%)
Net Sales
0.00
0.00
Operating Profit (PBDIT) excl Other Income
-0.44
-0.36
-22.22%
Interest
0.00
0.00
Exceptional Items
0.00
0.00
Standalone Net Profit
0.16
-0.27
159.26%
Operating Profit Margin (Excl OI)
0.00%
0.00%
NA
Values in Rs Cr.
Net Sales

QoQ Growth in quarter ended Jun 2026 is 0.00% vs 0.00% in Mar 2026

Direction Arrows
Standalone Net Profit

QoQ Growth in quarter ended Jun 2026 is 159.26% vs -58.82% in Mar 2026

Half Yearly Results Snapshot (Standalone) - Sep'25stock-summary

Sep'25
Sep'24
Change(%)
Net Sales
0.00
0.00
Operating Profit (PBDIT) excl Other Income
-0.50
-0.39
-28.21%
Interest
0.00
0.00
Exceptional Items
0.00
0.00
Standalone Net Profit
-0.31
0.32
-196.88%
Operating Profit Margin (Excl OI)
0.00%
0.00%
NA
Values in Rs Cr.
Net Sales

Growth in half year ended Sep 2025 is 0.00% vs 0.00% in Sep 2024

Direction Arrows
Standalone Net Profit

Growth in half year ended Sep 2025 is -196.88% vs -76.12% in Sep 2024

Nine Monthly Results Snapshot (Standalone) - Dec'25stock-summary

Dec'25
Dec'24
Change(%)
Net Sales
0.00
0.00
Operating Profit (PBDIT) excl Other Income
-0.73
-0.61
-19.67%
Interest
0.00
0.00
Exceptional Items
0.00
0.00
Standalone Net Profit
-0.48
0.23
-308.70%
Operating Profit Margin (Excl OI)
0.00%
0.00%
NA
Values in Rs Cr.
Net Sales

YoY Growth in nine months ended Dec 2025 is 0.00% vs 0.00% in Dec 2024

Direction Arrows
Standalone Net Profit

YoY Growth in nine months ended Dec 2025 is -308.70% vs -84.67% in Dec 2024

Annual Results Snapshot (Standalone) - Mar'26stock-summary

Mar'26
Mar'25
Change(%)
Net Sales
0.00
0.00
Operating Profit (PBDIT) excl Other Income
-1.09
-0.87
-25.29%
Interest
0.00
0.00
Exceptional Items
0.00
0.00
Standalone Net Profit
-0.75
0.09
-933.33%
Operating Profit Margin (Excl OI)
0.00%
0.00%
NA
Values in Rs Cr.
Net Sales

YoY Growth in year ended Mar 2026 is 0.00% vs 0.00% in Mar 2025

Direction Arrows
Standalone Net Profit

YoY Growth in year ended Mar 2026 is -933.33% vs -96.86% in Mar 2025

stock-summaryCompany CV
About Triveni Glass Ltd stock-summary
stock-summary
Triveni Glass Ltd
Micro Cap
Miscellaneous
Late Mr. D. N. Agrawal in 1956, brought to India the first technology to manufacture laminated safety glass for automobiles. Thereafter, he added other products like tempered glass, mirrors, etc. In all these products, his group was the pioneer in India. Due to shortage of sheet glass in India at that time, he had set up a vertical draw sheet glass plant at Allahabad (U.
Company Coordinates stock-summary
Company Details
1 Kanpur Road , Allahabad Uttar Pradesh : 211001
stock-summary
Tel: 91-0532-2407325
stock-summary
akd@triveniglassltd.com
Registrar Details
CB Management Services Pvt Ltd , (Formerly Choksey Bhargava & Co Ltd) , P-22, P 22 Bondel Road, Calcutta