
Compare TruAlt Bioenergy with Similar Stocks
Stock DNA
Commodity Chemicals
INR 3,550 Cr (Small Cap)
37.00
46
0.00%
1.01
5.29%
2.39
Total Returns (Price + Dividend) 
TruAlt Bioenergy for the last several years.
Risk Adjusted Returns v/s
Returns Beta

News

TruAlt Bioenergy Ltd is Rated Sell
TruAlt Bioenergy Ltd is rated 'Sell' by MarketsMOJO, with this rating last updated on 30 March 2026. However, the analysis and financial metrics discussed here reflect the stock's current position as of 10 July 2026, providing investors with an up-to-date perspective on the company’s fundamentals, valuation, financial trends, and technical outlook.
Read full news article
TruAlt Bioenergy Ltd Faces Mildly Bearish Technical Shift Amid Market Volatility
TruAlt Bioenergy Ltd, a small-cap player in the commodity chemicals sector, has experienced a notable shift in its technical momentum, moving from a mildly bullish to a mildly bearish trend. Recent technical indicators including MACD, RSI, and Bollinger Bands signal caution for investors as the stock price declined by 2.91% on 9 July 2026, closing at ₹443.55.
Read full news article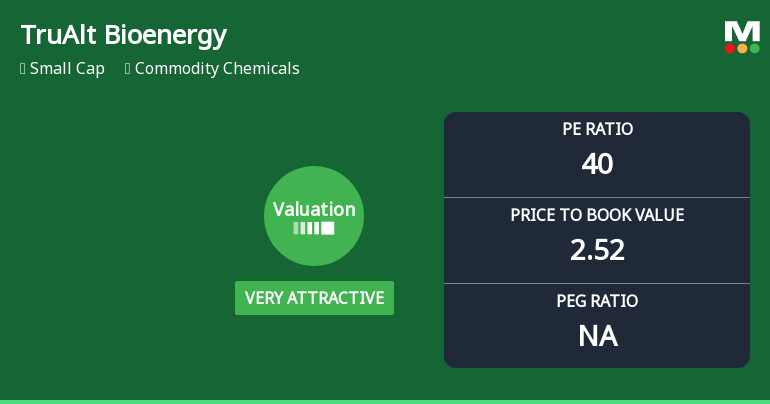
TruAlt Bioenergy Ltd Valuation Shifts Signal Renewed Price Attractiveness Amid Sector Challenges
TruAlt Bioenergy Ltd, a small-cap player in the commodity chemicals sector, has seen a notable shift in its valuation parameters, moving from an attractive to a very attractive rating. Despite a recent decline in share price and a challenging industry backdrop, the company’s price-to-earnings (P/E) and price-to-book value (P/BV) ratios now present a compelling case for value-oriented investors seeking exposure in this segment.
Read full news article Announcements
Compliances-Certificate under Reg. 74 (5) of SEBI (DP) Regulations 2018
10-Jul-2026 | Source : BSEPlease find attached Certificate.
Shareholder Meeting / Postal Ballot-Scrutinizers Report
10-Jul-2026 | Source : BSEPlease find enclosed the Intimation
Closure of Trading Window
26-Jun-2026 | Source : BSEThe window for trading in the equity shares of the Company will be closed from July 1 2026 till 48 hours after submission of financial results for the Quarter ended June 30 2026 with the Stock Exchanges.
Corporate Actions

No Upcoming Board Meetings

No Dividend history available

No Splits history available

No Bonus history available

No Rights history available
Quality key factors
Valuation key factors
Technicals key factors
 Technical Indicator Scale: Bearish, Mildly Bearish, Sideways, Mildly Bullish, Bullish Turned
 Shareholding Snapshot : Mar 2026
Shareholding Compare (%holding)
Promoters
36.8532
Held by 5 Schemes (6.7%)
Held by 11 FIIs (0.66%)
Vijaykumar Nirani (17.88%)
Rakeshkumar Viththalbhai Patel (3.82%)
13.5%
Quarterly Results Snapshot (Standalone) - Mar'26 - QoQ

QoQ Growth in quarter ended Mar 2026 is -14.20% vs 572.88% in Dec 2025
QoQ Growth in quarter ended Mar 2026 is -14.07% vs 254.43% in Dec 2025
Half Yearly Results Snapshot (Standalone) - Sep'25
Not Applicable: The company has declared_date for only one period
Not Applicable: The company has declared_date for only one period
Nine Monthly Results Snapshot (Standalone) - Dec'25
Not Applicable: The company has declared_date for only one period
Not Applicable: The company has declared_date for only one period
Annual Results Snapshot (Standalone) - Mar'26
YoY Growth in year ended Mar 2026 is -9.33% vs 53.68% in Mar 2025
YoY Growth in year ended Mar 2026 is -43.09% vs 342.06% in Mar 2025
About TruAlt Bioenergy Ltd

Company Coordinates


