
Compare TruCap Finance with Similar Stocks
Dashboard
With a Operating Losses, the company has a Weak Long Term Fundamental Strength
- Poor long term growth as Operating profit has grown by an annual rate of -256.32%
The company has declared Negative results for the last 5 consecutive quarters
Risky - Negative EBITDA
Consistent Underperformance against the benchmark over the last 3 years
Stock DNA
Non Banking Financial Company (NBFC)
INR 69 Cr (Micro Cap)
NA (Loss Making)
21
0.00%
6.50
-203.18%
1.37
Total Returns (Price + Dividend) 
Latest dividend: 0 per share ex-dividend date: Sep-19-2024
Risk Adjusted Returns v/s
Returns Beta

News

TruCap Finance Ltd is Rated Strong Sell
TruCap Finance Ltd is rated Strong Sell by MarketsMOJO, with this rating last updated on 09 September 2025. However, the analysis and financial metrics discussed here reflect the company’s current position as of 17 June 2026, providing investors with an up-to-date view of its fundamentals, valuation, financial trends, and technical outlook.
Read full news article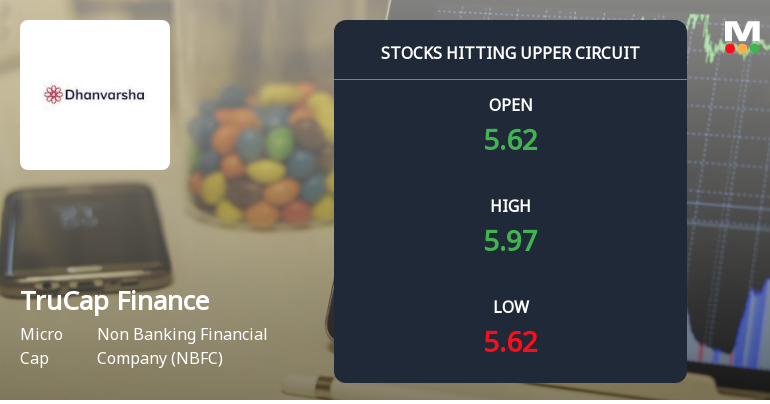
TruCap Finance Ltd Locks at Upper Circuit With 1.23% Gain Amid Rising Delivery Volumes
At Rs 5.95, the buying was done — not because demand dried up, but because the exchange wouldn't let the stock go any higher. TruCap Finance Ltd locked at its upper circuit of 5% on 15 Jun 2026, with buyers queuing and no sellers willing to part with shares, signalling unfilled demand at the ceiling price.
Read full news article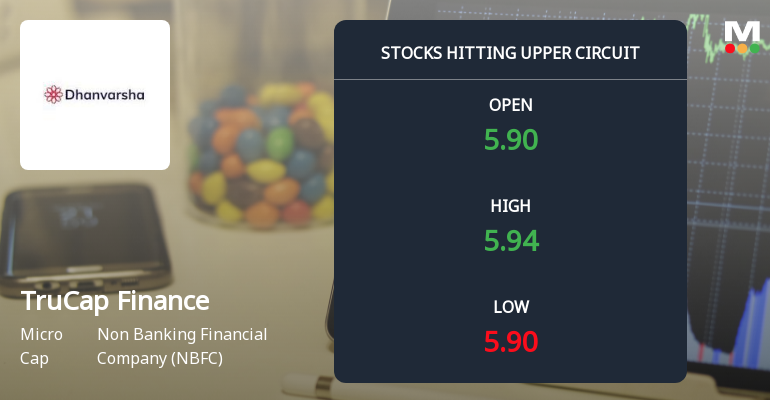
TruCap Finance Ltd Locks at Upper Circuit With 4.93% Gain — Buyers Queue, Sellers Absent
At Rs 5.96, the buying was done — not because demand dried up, but because the exchange wouldn't let the stock go any higher. TruCap Finance Ltd locked at its upper circuit of 4.93% on 11 Jun 2026, with buyers queuing and no sellers willing to part with shares.
Read full news article Announcements
Updates on Open Offer
17-Jun-2026 | Source : BSESundae Capital Advisors Pvt Ltd (Manager to the Offer) has informed BSE as under :
This in continuation to our submission made on June 15 2026 we are hereby submitting the following update on the matter.
The matter was listed for hearing on June 16 2026 wherein the matter was listed for hearing before the Honble Securities Appellate Tribunal. The counsel for the Appellant put forth the arguments. However due to paucity of time the matter is part-heard and has been further listed for hearing on Thursday June 18 2026. Further the interim stay granted vide the earlier order dated February 11 2026 has been extended until the next date of hearing.
Updates on Open Offer
15-Jun-2026 | Source : BSESundae Capital Advisors Pvt Ltd (Manager to the Offer) has informed BSE as under :
This in continuation to our submission made on April 24 2026 we are hereby submitting the following update on the matter.
The matter was listed for hearing on June 12 2026 wherein the matter was listed for hearing before the Honble Securities Appellate Tribunal. The counsel for the Appellant put forth the arguments. However due to paucity of time the Appellants submissions could not be concluded. Accordingly the matter is now further listed for hearing on June 16 2026 at 2:30 pm. Further the interim stay granted vide the earlier order dated February 11 2026 has been extended until the next date of hearing.
Announcement under Regulation 30 (LODR)-Newspaper Publication
27-May-2026 | Source : BSESubmission of copy of newspaper publication(s) regarding audited financial results for the quarter and year ended March 31 2026.
Corporate Actions

No Upcoming Board Meetings


TruCap Finance Ltd has announced 2:10 stock split, ex-date: 13 Oct 21

No Bonus history available

No Rights history available
Quality key factors
Valuation key factors
Technicals key factors
 Technical Indicator Scale: Bearish, Mildly Bearish, Sideways, Mildly Bullish, Bullish Turned
 Shareholding Snapshot : Mar 2026
Shareholding Compare (%holding)
Non Institution
None
Held by 0 Schemes
Held by 2 FIIs (5.19%)
Wilson Holdings Private Limited (25.05%)
Ind Swift Laboratories (4.66%)
37.77%
Quarterly Results Snapshot (Consolidated) - Mar'26 - YoY

YoY Growth in quarter ended Mar 2026 is -58.86% vs -14.59% in Mar 2025

YoY Growth in quarter ended Mar 2026 is 71.68% vs -1,290.33% in Mar 2025
Half Yearly Results Snapshot (Consolidated) - Sep'25
Growth in half year ended Sep 2025 is -51.82% vs 36.07% in Sep 2024
Growth in half year ended Sep 2025 is -2,000.00% vs -8.68% in Sep 2024
Nine Monthly Results Snapshot (Consolidated) - Dec'25
YoY Growth in nine months ended Dec 2025 is -57.86% vs 33.90% in Dec 2024
YoY Growth in nine months ended Dec 2025 is -2,763.72% vs -39.85% in Dec 2024
Annual Results Snapshot (Consolidated) - Mar'26
YoY Growth in year ended Mar 2026 is -58.04% vs 21.51% in Mar 2025
YoY Growth in year ended Mar 2026 is -90.13% vs -640.60% in Mar 2025
About TruCap Finance Ltd

Company Coordinates


