
Compare TruCap Finance with Similar Stocks
Dashboard
With a Operating Losses, the company has a Weak Long Term Fundamental Strength
- Poor long term growth as Operating profit has grown by an annual rate of -285.12%
With a fall in Net Sales of -70.72%, the company declared Very Negative results in Dec 25
Risky - Negative EBITDA
Below par performance in long term as well as near term
Stock DNA
Non Banking Financial Company (NBFC)
INR 73 Cr (Micro Cap)
NA (Loss Making)
21
0.00%
3.02
-100.78%
0.66
Total Returns (Price + Dividend) 
Latest dividend: 0 per share ex-dividend date: Sep-19-2024
Risk Adjusted Returns v/s
Returns Beta

News

TruCap Finance Ltd is Rated Strong Sell
TruCap Finance Ltd is rated Strong Sell by MarketsMOJO. This rating was last updated on 09 Sep 2025. However, the analysis and financial metrics discussed here reflect the stock’s current position as of 15 May 2026, providing investors with the latest insights into the company’s performance and outlook.
Read full news article
TruCap Finance Ltd Locks at Upper Circuit With 2.37% Gain — Buyers Queue, Sellers Absent
At Rs 6.64, the buying was done — not because demand dried up, but because the exchange wouldn't let the stock go any higher. TruCap Finance Ltd locked at its upper circuit of 2.37% on 13 May 2026, with buyers queuing and no sellers willing to part with shares.
Read full news article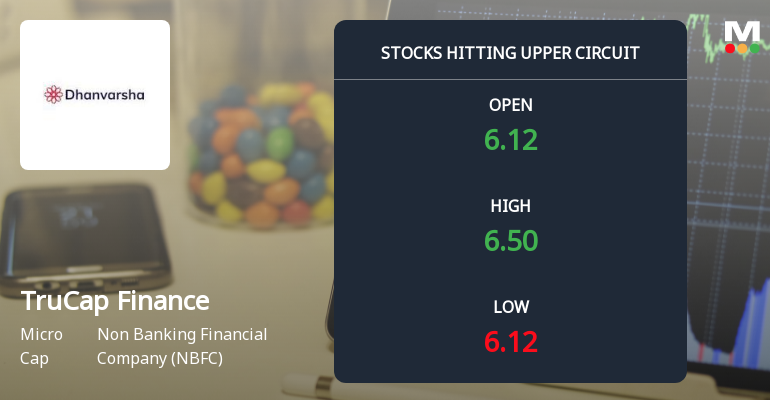
TruCap Finance Ltd Locks at Upper Circuit With 4.64% Gain — Buyers Queue, Sellers Absent
At Rs 6.56, the buying was done — not because demand dried up, but because the exchange wouldn't let the stock go any higher. TruCap Finance Ltd locked at its upper circuit of 4.64% on 6 May 2026, with buyers queuing and no sellers willing to part with shares.
Read full news article Announcements
Corporate Actions

No Upcoming Board Meetings


TruCap Finance Ltd has announced 2:10 stock split, ex-date: 13 Oct 21

No Bonus history available

No Rights history available
Quality key factors
Valuation key factors
Technicals key factors
 Technical Indicator Scale: Bearish, Mildly Bearish, Sideways, Mildly Bullish, Bullish Turned
 Shareholding Snapshot : Mar 2026
Shareholding Compare (%holding)
Non Institution
None
Held by 0 Schemes
Held by 2 FIIs (5.19%)
Wilson Holdings Private Limited (25.05%)
Ind Swift Laboratories (4.66%)
37.77%
Quarterly Results Snapshot (Consolidated) - Dec'25 - YoY

YoY Growth in quarter ended Dec 2025 is -70.72% vs 29.51% in Dec 2024
YoY Growth in quarter ended Dec 2025 is -4,521.88% vs -66.32% in Dec 2024
Half Yearly Results Snapshot (Consolidated) - Sep'25
Growth in half year ended Sep 2025 is -51.82% vs 36.07% in Sep 2024
Growth in half year ended Sep 2025 is -2,000.00% vs -8.68% in Sep 2024
Nine Monthly Results Snapshot (Consolidated) - Dec'25
YoY Growth in nine months ended Dec 2025 is -57.86% vs 33.90% in Dec 2024
YoY Growth in nine months ended Dec 2025 is -2,763.72% vs -39.85% in Dec 2024
Annual Results Snapshot (Consolidated) - Mar'25
YoY Growth in year ended Mar 2025 is 21.51% vs 30.84% in Mar 2024
YoY Growth in year ended Mar 2025 is -640.60% vs 1,639.68% in Mar 2024
About TruCap Finance Ltd

Company Coordinates


