
Compare Trupanion, Inc. with Similar Stocks
Dashboard
Strong Long Term Fundamental Strength with a 82.26% CAGR growth in Operating Profits
Healthy long term growth as Net Sales has grown by an annual rate of 25.67% and Operating profit at 82.26%
With a growth in Operating Profit of 110.31%, the company declared Very Positive results in Jun 25
Total Returns (Price + Dividend) 
Trupanion, Inc. for the last several years.
Risk Adjusted Returns v/s
News

Trupanion Stock Hits Day Low of $38.13 Amid Price Pressure
Trupanion, Inc. faced a notable decline in its stock price today, reflecting broader challenges in the market. Despite recent fluctuations, the company has shown strong long-term fundamentals, including a significant compound annual growth rate in operating profits and consistent positive results over the last five quarters.
Read full news article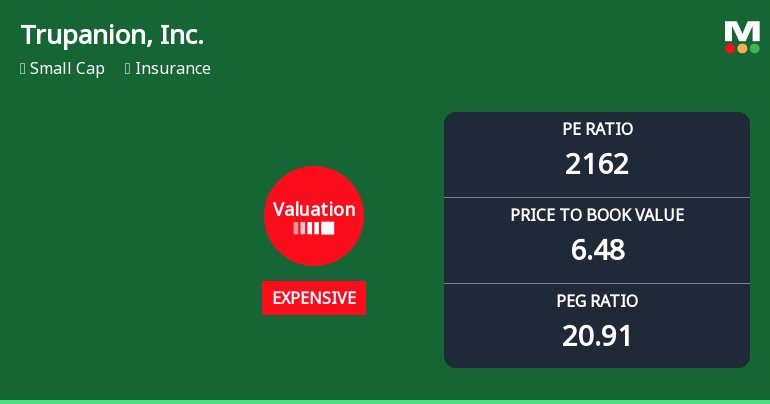
Trupanion, Inc. Experiences Revision in Its Stock Evaluation Amid Competitive Landscape
Trupanion, Inc. has recently adjusted its valuation, revealing high financial metrics such as a P/E ratio of 2162 and a PEG ratio of 20.91. Compared to peers like AXIS Capital and MGIC Investment, Trupanion's stock has struggled, showing a year-to-date return significantly lower than the S&P 500.
Read full news article
Trupanion Stock Soars 7.16%, Hits Intraday High of $42.52
Trupanion, Inc. has shown significant performance today, contrasting with broader market trends. Despite a challenging year, the company boasts strong long-term fundamentals, including impressive growth rates in operating profits and net sales. Its operational strength is reflected in consistent positive results and full institutional ownership, indicating robust investor confidence.
Read full news article Announcements

Corporate Actions
Quality key factors
Valuation key factors
Technicals key factors
 Technical Indicator Scale: Bearish, Mildly Bearish, Sideways, Mildly Bullish, Bullish Turned
 Shareholding Snapshot : Sep 2025
Shareholding Compare (%holding)
Domestic Funds
Held in 48 Schemes (35.44%)
Held by 112 Foreign Institutions (20.52%)
Quarterly Results Snapshot (Consolidated) - Sep'25 - YoY
YoY Growth in quarter ended Sep 2025 is 0.00% vs 0.00% in Sep 2024

YoY Growth in quarter ended Sep 2025 is 321.43% vs 135.00% in Sep 2024
Annual Results Snapshot (Consolidated) - Dec'24
YoY Growth in year ended Dec 2024 is 0.00% vs 0.00% in Dec 2023
YoY Growth in year ended Dec 2024 is 78.52% vs 0.00% in Dec 2023
About Trupanion, Inc.

Company Coordinates


