
Compare Tsf Investments with Similar Stocks
Dashboard
Strong Long Term Fundamental Strength with a 70.25% CAGR growth in Operating Profits
Healthy long term growth as Net Sales has grown by an annual rate of 75.35% and Operating profit at 70.25%
With a growth in Net Sales of 502.98%, the company declared Very Positive results in Mar 26
With ROE of 8.7, it has a Attractive valuation with a 1.6 Price to Book Value
Majority shareholders : Promoters
Below par performance in long term as well as near term
Stock DNA
Holding Company
INR 9,788 Cr (Small Cap)
19.00
21
2.52%
0.04
8.67%
1.63
Total Returns (Price + Dividend) 
Latest dividend: 4.45 per share ex-dividend date: Jul-07-2026
Risk Adjusted Returns v/s
Returns Beta

News

Tsf Investments Ltd Technical Momentum Shifts Amid Mixed Indicator Signals
Tsf Investments Ltd, a small-cap holding company, has experienced a notable shift in its technical momentum, moving from a sideways trend to a mildly bullish stance. Despite mixed signals from key technical indicators such as MACD, RSI, and moving averages, the stock’s recent price action and volume patterns suggest emerging optimism among investors, warranting a closer examination of its technical landscape and market positioning.
Read full news article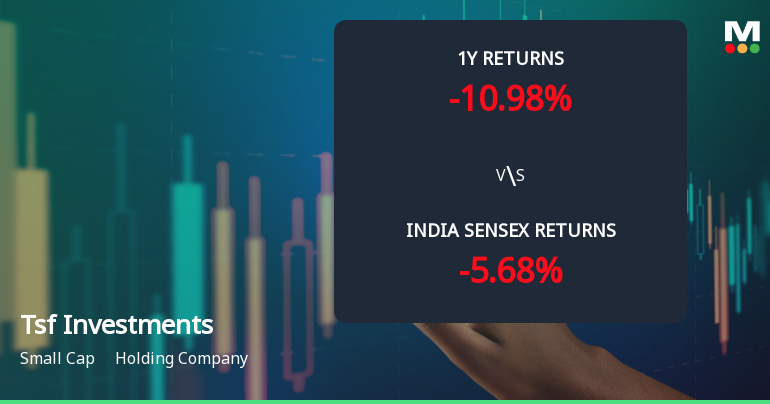
Tsf Investments Ltd Technical Momentum Shifts Amid Sideways Trend
Tsf Investments Ltd, a small-cap holding company, has experienced a notable shift in its technical momentum, moving from a mildly bullish stance to a sideways trend. Despite a modest day decline of 0.28%, the stock’s technical indicators reveal a complex interplay of bullish and bearish signals across different timeframes, prompting a reassessment of its near-term outlook.
Read full news article
Tsf Investments Ltd is Rated Buy
Tsf Investments Ltd is rated Buy by MarketsMOJO, with this rating last updated on 30 June 2026. However, the analysis and financial metrics discussed here reflect the stock’s current position as of 27 July 2026, providing investors with the most up-to-date view of the company’s fundamentals, returns, and technical outlook.
Read full news article Announcements
Corporate Actions

04 Aug 2026

Tsf Investments Ltd has declared 89% dividend, ex-date: 07 Jul 26

No Splits history available

No Bonus history available

Tsf Investments Ltd has announced 23:49 rights issue, ex-date: 26 Apr 21
Quality key factors
Valuation key factors
Technicals key factors
 Technical Indicator Scale: Bearish, Mildly Bearish, Sideways, Mildly Bullish, Bullish Turned
 Shareholding Snapshot : Jun 2026
Shareholding Compare (%holding)
Promoters
None
Held by 8 Schemes (3.95%)
Held by 51 FIIs (3.27%)
Sundaram Finance Limited (19.9%)
Nippon Life India Trustee Ltd-a/c Nippon India Small Cap Fund (3.69%)
25.38%
Quarterly Results Snapshot (Consolidated) - Mar'26 - YoY

YoY Growth in quarter ended Mar 2026 is 502.98% vs -77.32% in Mar 2025
YoY Growth in quarter ended Mar 2026 is 50.36% vs -60.23% in Mar 2025
Half Yearly Results Snapshot (Consolidated) - Sep'25
Growth in half year ended Sep 2025 is 490.31% vs 50.10% in Sep 2024
Growth in half year ended Sep 2025 is 29.32% vs 23.46% in Sep 2024
Nine Monthly Results Snapshot (Consolidated) - Dec'25
YoY Growth in nine months ended Dec 2025 is 553.17% vs 42.76% in Dec 2024
YoY Growth in nine months ended Dec 2025 is 18.28% vs 15.59% in Dec 2024
Annual Results Snapshot (Consolidated) - Mar'26
YoY Growth in year ended Mar 2026 is 537.10% vs -46.93% in Mar 2025
YoY Growth in year ended Mar 2026 is 26.61% vs -22.70% in Mar 2025
About Tsf Investments Ltd

Company Coordinates


