
Compare Tsugami Corp. with Similar Stocks
Dashboard
Strong Long Term Fundamental Strength with an average Return on Equity (ROE) of 21.27%
- Healthy long term growth as Net Sales has grown by an annual rate of 16.85% and Operating profit at 36.88%
- Company's ability to service its debt is strong with a healthy EBIT to Interest (avg) ratio of 34.14
The company has declared Positive results for the last 4 consecutive quarters
With ROE of 25.73%, it has a very attractive valuation with a 1.44 Price to Book Value
Market Beating performance in long term as well as near term
Stock DNA
Industrial Manufacturing
JPY 107,856 Million (Small Cap)
6.00
NA
0.02%
-0.28
29.18%
1.68
Total Returns (Price + Dividend) 
Tsugami Corp. for the last several years.
Risk Adjusted Returns v/s
News
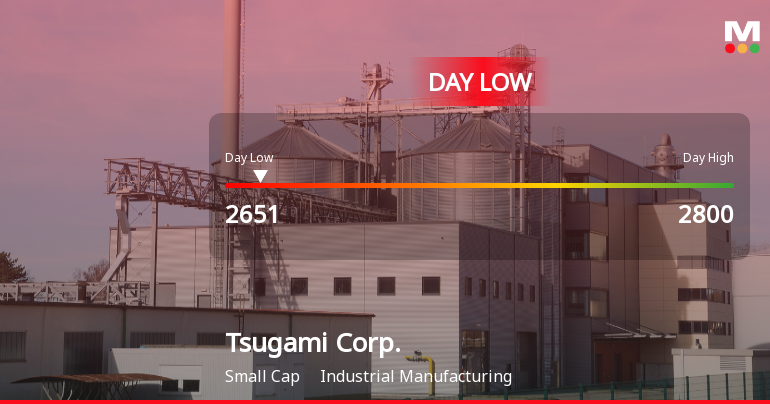
Tsugami Corp. Hits Day Low of JPY 2,651 Amid Price Pressure
Tsugami Corp., a small-cap industrial manufacturer, saw its stock decline significantly on October 29, 2025. Despite this drop, the company has performed well over the past year, with substantial increases in stock value and strong financial metrics, including a high return on equity and consistent growth in sales and profits.
Read full news article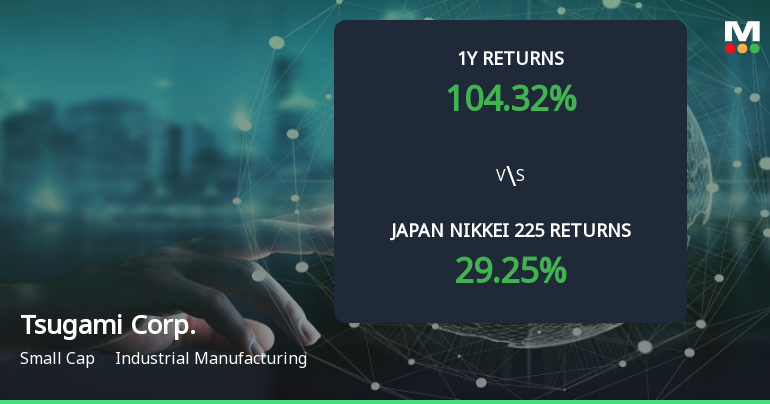
Tsugami Corp. Achieves 104.32% Return, Establishing It as a Multibagger in Manufacturing Sector
Tsugami Corp. has recently undergone a revision in its score, reflecting its strong market performance and financial metrics. The company has achieved significant growth over the past year, outpacing major indices, and continues to demonstrate resilience with impressive short-term gains. Its solid return on equity and consistent positive results further underscore its robust market position.
Read full news article Announcements

Corporate Actions
Quality key factors
Valuation key factors
Technicals key factors
 Technical Indicator Scale: Bearish, Mildly Bearish, Sideways, Mildly Bullish, Bullish Turned
 Shareholding Snapshot : Sep 2011
Shareholding Compare (%holding)
Foreign Institutions
Held in 0 Schemes (0%)
Held by 1 Foreign Institutions (0.27%)
Quarterly Results Snapshot (Consolidated) - Jun'25 - QoQ

QoQ Growth in quarter ended Jun 2025 is -2.26% vs 29.60% in Mar 2025
QoQ Growth in quarter ended Jun 2025 is 21.16% vs 21.84% in Mar 2025
Annual Results Snapshot (Consolidated) - Mar'25

YoY Growth in year ended Mar 2025 is 27.98% vs -11.62% in Mar 2024
YoY Growth in year ended Mar 2025 is 97.85% vs -24.57% in Mar 2024
About Tsugami Corp.

Company Coordinates


