
Compare Tulsyan NEC with Similar Stocks
Dashboard
With a Operating Losses, the company has a Weak Long Term Fundamental Strength
- Poor long term growth as Net Sales has grown by an annual rate of -7.54% and Operating profit at -162.32% over the last 5 years
- Low ability to service debt as the company has a high Debt to EBITDA ratio of -406.21 times
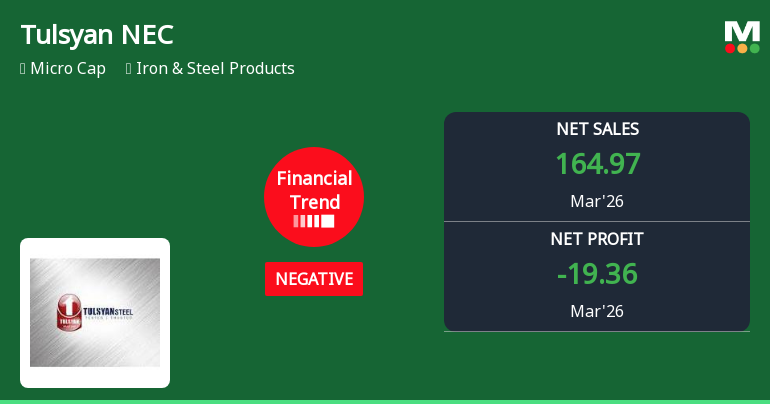
Negative results in Mar 26
Risky - Negative EBITDA
99.63% of Promoter Shares are Pledged
Consistent Underperformance against the benchmark over the last 3 years
Stock DNA
Iron & Steel Products
INR 59 Cr (Micro Cap)
NA (Loss Making)
14
0.00%
2.18
-34.67%
0.32
Total Returns (Price + Dividend) 
Latest dividend: 1.5 per share ex-dividend date: Sep-20-2012
Risk Adjusted Returns v/s
Returns Beta

News
Tulsyan NEC Ltd Reports Declining Quarterly Performance Amid Rising Debt Concerns
Tulsyan NEC Ltd, a micro-cap player in the Iron & Steel Products sector, has reported a marked deterioration in its financial performance for the quarter ended March 2026. The company’s revenue and profitability have contracted sharply compared to its recent historical averages, while its debt levels have surged, raising concerns about its financial stability and future prospects.
Read full news articleAre Tulsyan NEC Ltd latest results good or bad?
Tulsyan NEC Ltd's latest financial results for Q4 FY26 reveal significant challenges within its operational framework. The company reported a net loss of ₹19.36 crore, which represents a deterioration compared to the previous quarter. Revenue for the quarter was ₹164.97 crore, showing a modest sequential improvement of 5.68% from Q3 FY26, yet it remains 22.91% lower than the same quarter last year. This revenue volatility underscores ongoing difficulties in maintaining consistent sales performance. The operating margin for Q4 FY26 was recorded at -2.60%, indicating that the company continues to struggle with profitability, having only achieved positive margins in two of the last seven quarters. The interest coverage ratio stands at -0.22 times, reflecting severe challenges in servicing its debt obligations, which amounted to ₹21.20 crore in interest costs for the quarter. This high interest burden, coupled...
Read full news article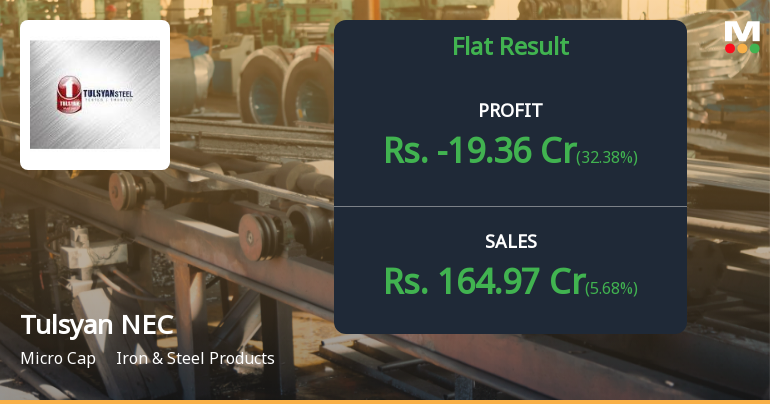
Tulsyan NEC Q4 FY26: Mounting Losses Signal Deepening Operational Crisis
Tulsyan NEC Ltd., a Chennai-based manufacturer of Thermo Mechanically Treated (TMT) bars and steel products, reported a quarterly net loss of ₹19.36 crores for Q4 FY26 ended March 2026, deepening its financial distress as operational inefficiencies and mounting interest costs continue to erode shareholder value. The loss widened by 32.38% sequentially from ₹28.63 crores in Q3 FY26, whilst year-on-year deterioration stood at 53.72% compared to a loss of ₹41.83 crores in Q4 FY25. With a market capitalisation of just ₹58 crores and shares trading at ₹35.00, the micro-cap steel manufacturer faces an uphill battle to restore profitability.
Read full news article Announcements
Announcement under Regulation 30 (LODR)-Newspaper Publication
31-May-2026 | Source : BSENewspaper Advertisement - Audited Financials Results of the Company for the quarter and year ended March 31 2026.
Board Meeting Outcome for Outcome Of Board Meeting Held On May 30 2026
30-May-2026 | Source : BSEOutcome of Board Meeting held on May 30 2026
Audited Standalone And Consolidated Financial Results Of The Company For The Quarter And Year Ended March 31 2026
30-May-2026 | Source : BSEAudited standalone and consolidated financial results of the Company for the quarter and year ended March 31 2026
Corporate Actions

No Upcoming Board Meetings

Tulsyan NEC Ltd has declared 15% dividend, ex-date: 20 Sep 12

No Splits history available

No Bonus history available

Tulsyan NEC Ltd has announced 2:1 rights issue, ex-date: 10 Mar 11
Quality key factors
Valuation key factors
Technicals key factors
 Technical Indicator Scale: Bearish, Mildly Bearish, Sideways, Mildly Bullish, Bullish Turned
 Shareholding Snapshot : Mar 2026
Shareholding Compare (%holding)
Promoters
99.6262
Held by 0 Schemes
Held by 0 FIIs
Sanjay Tulsyan (27.19%)
India Special Assets Fund Iii (a Scheme Of Isaf Iii) (6.99%)
14.7%
Quarterly Results Snapshot (Consolidated) - Mar'26 - QoQ

QoQ Growth in quarter ended Mar 2026 is 5.68% vs -31.89% in Dec 2025
QoQ Growth in quarter ended Mar 2026 is 32.38% vs -370.11% in Dec 2025
Half Yearly Results Snapshot (Consolidated) - Sep'25
Growth in half year ended Sep 2025 is 2.61% vs -1.79% in Sep 2024

Growth in half year ended Sep 2025 is -333.42% vs 74.46% in Sep 2024
Nine Monthly Results Snapshot (Consolidated) - Dec'25
YoY Growth in nine months ended Dec 2025 is -1.79% vs -11.04% in Dec 2024
YoY Growth in nine months ended Dec 2025 is -46.34% vs -5.17% in Dec 2024
Annual Results Snapshot (Consolidated) - Mar'26
YoY Growth in year ended Mar 2026 is -7.00% vs -11.12% in Mar 2025
YoY Growth in year ended Mar 2026 is 11.34% vs -47.75% in Mar 2025
About Tulsyan NEC Ltd

Company Coordinates


