
Compare Tuticorin Alkali with Similar Stocks
Dashboard
The company has declared Negative results for the last 10 consecutive quarters
- ROCE(HY) Lowest at 19.73%
- OPERATING PROFIT TO INTEREST (Q) Lowest at 6.09 times
- PAT(Q) At Rs 8.02 cr has Fallen at -10.5% (vs previous 4Q average)
Despite the size of the company, domestic mutual funds hold only 0.01% of the company
Underperformed the market in the last 1 year
Stock DNA
Commodity Chemicals
INR 658 Cr (Micro Cap)
18.00
43
0.00%
0.62
20.25%
3.56
Total Returns (Price + Dividend) 
Tuticorin Alkali for the last several years.
Risk Adjusted Returns v/s
Returns Beta

News
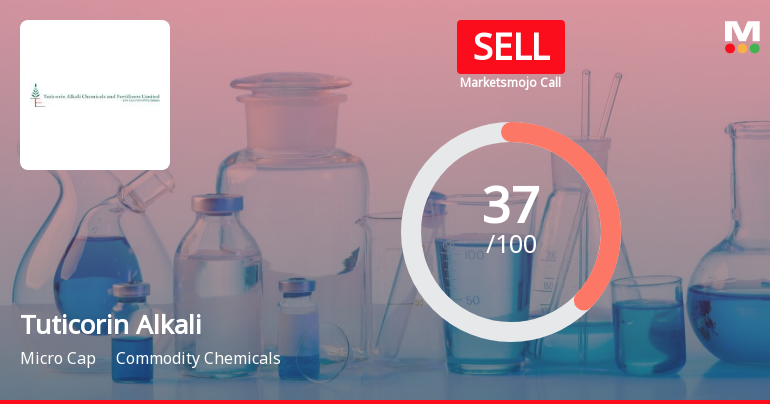
Tuticorin Alkali Chemicals & Fertilizers Ltd is Rated Sell
Tuticorin Alkali Chemicals & Fertilizers Ltd is rated 'Sell' by MarketsMOJO. This rating was last updated on 24 Nov 2025. However, the analysis and financial metrics presented here reflect the stock's current position as of 20 June 2026, providing investors with an up-to-date view of the company's performance and outlook.
Read full news article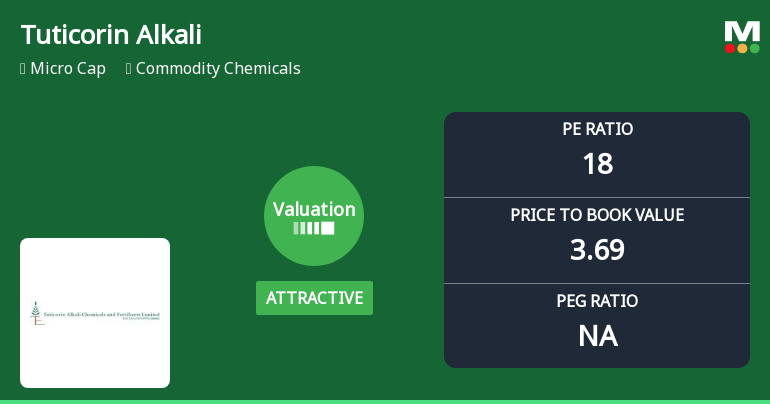
Tuticorin Alkali Chemicals & Fertilizers Ltd: Valuation Shifts Signal Renewed Price Attractiveness
Tuticorin Alkali Chemicals & Fertilizers Ltd has witnessed a notable improvement in its valuation parameters, shifting from a very attractive to an attractive rating. This change reflects a recalibration in price-to-earnings and price-to-book value ratios, positioning the micro-cap commodity chemicals company more favourably against its peers and historical benchmarks. Despite a mixed performance relative to the Sensex, the stock’s valuation metrics and operational returns warrant a closer examination for investors seeking opportunities in the sector.
Read full news article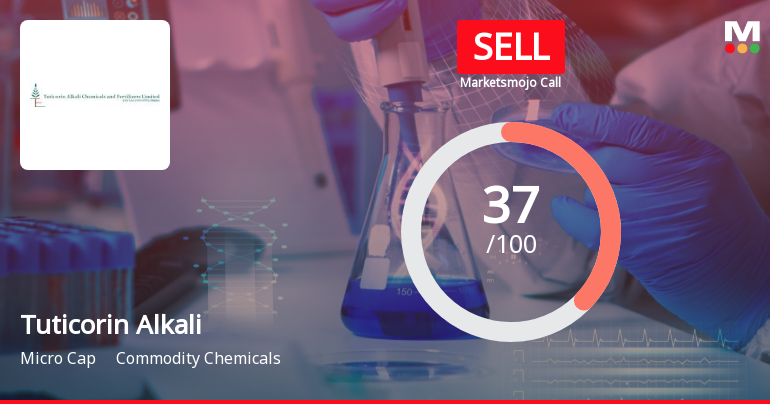
Tuticorin Alkali Chemicals & Fertilizers Ltd is Rated Sell
Tuticorin Alkali Chemicals & Fertilizers Ltd is rated 'Sell' by MarketsMOJO, with this rating last updated on 24 Nov 2025. However, the analysis and financial metrics discussed here reflect the stock's current position as of 09 June 2026, providing investors with an up-to-date perspective on the company’s performance and outlook.
Read full news article Announcements
Compliances-Reg.24(A)-Annual Secretarial Compliance
30-May-2026 | Source : BSEAnnual secertarial Compliance Report for the year ended 2025-26.
A. Audited Financial Results Of The Company For The Year Ended 31St March 2026 Pursuant To Regulation 33 Of SEBI (Listing Obligations And Disclosure Requirements) Regulation 2015. A Copy Of The Audited Financial Results For The Quarter Ended 31St March 20
18-May-2026 | Source : BSEApproval of Audited financial statements for the FY 2025-26
Announcement under Regulation 30 (LODR)-Change in Directorate
18-May-2026 | Source : BSEAppointment of Mr E Rajeshkumar (DIN:10207780) as the wholetime director of the company wef 8th July 2026 subject to the approval of the shareholders.
Corporate Actions

No Upcoming Board Meetings

No Dividend history available

No Splits history available

No Bonus history available

No Rights history available
Quality key factors
Valuation key factors
Technicals key factors
 Technical Indicator Scale: Bearish, Mildly Bearish, Sideways, Mildly Bullish, Bullish Turned
 Shareholding Snapshot : Mar 2026
Shareholding Compare (%holding)
Promoters
None
Held by 5 Schemes (0.0%)
Held by 3 FIIs (1.37%)
Ami Holdings Private Limited (46.61%)
Mercantile Ventures Limited (11.3%)
6.7%
Quarterly Results Snapshot (Standalone) - Mar'26 - QoQ

QoQ Growth in quarter ended Mar 2026 is -15.01% vs 22.74% in Dec 2025
QoQ Growth in quarter ended Mar 2026 is -12.35% vs -4.29% in Dec 2025
Half Yearly Results Snapshot (Standalone) - Sep'25

Growth in half year ended Sep 2025 is 6.41% vs -22.03% in Sep 2024
Growth in half year ended Sep 2025 is -61.17% vs 30.06% in Sep 2024
Nine Monthly Results Snapshot (Standalone) - Dec'25
YoY Growth in nine months ended Dec 2025 is 11.26% vs -13.52% in Dec 2024
YoY Growth in nine months ended Dec 2025 is -47.97% vs -4.68% in Dec 2024
Annual Results Snapshot (Standalone) - Mar'26
YoY Growth in year ended Mar 2026 is 9.14% vs -3.39% in Mar 2025
YoY Growth in year ended Mar 2026 is -41.13% vs -10.66% in Mar 2025
About Tuticorin Alkali Chemicals & Fertilizers Ltd

Company Coordinates


