
Compare TV Vision with Similar Stocks
Dashboard
With a Negative Book Value, the company has a Weak Long Term Fundamental Strength
- Poor long term growth as Net Sales has grown by an annual rate of -26.93% and Operating profit at 0% over the last 5 years
- The company has a negative book value of Rs 178.26 crore
The company has declared Negative results for the last 6 consecutive quarters
Risky - Negative EBITDA
49.81% of Promoter Shares are Pledged
Underperformed the market in the last 1 year
Stock DNA
Media & Entertainment
INR 21 Cr (Micro Cap)
NA (Loss Making)
21
0.00%
-0.02
19.34%
-0.11
Total Returns (Price + Dividend) 
TV Vision for the last several years.
Risk Adjusted Returns v/s
Returns Beta

News
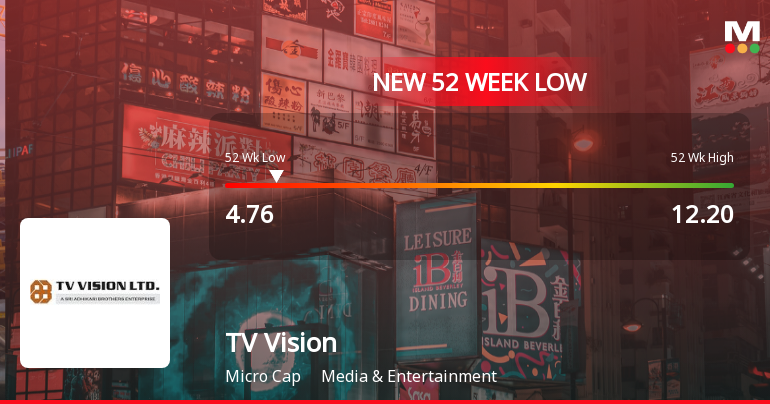
Markets Rally, But TV Vision Ltd Sinks to 52-Week Low in Stock-Specific Sell-Off
Despite a broadly positive market backdrop, TV Vision Ltd plunged to a fresh 52-week low of Rs 4.76 on 16 Jun 2026, marking a sharp 12.98% decline on the day and extending its underperformance over the past year to a steep 40.57% drop.
Read full news article
TV Vision Ltd Falls to 52-Week Low of Rs 4.8 as Sell-Off Deepens
A sharp decline has pushed TV Vision Ltd to a fresh 52-week low of Rs 4.8 on 12 Jun 2026, marking a significant 60.7% drop from its peak of Rs 12.2 within the past year. This downturn comes amid persistent financial headwinds and a challenging market environment for the micro-cap media player.
Read full news article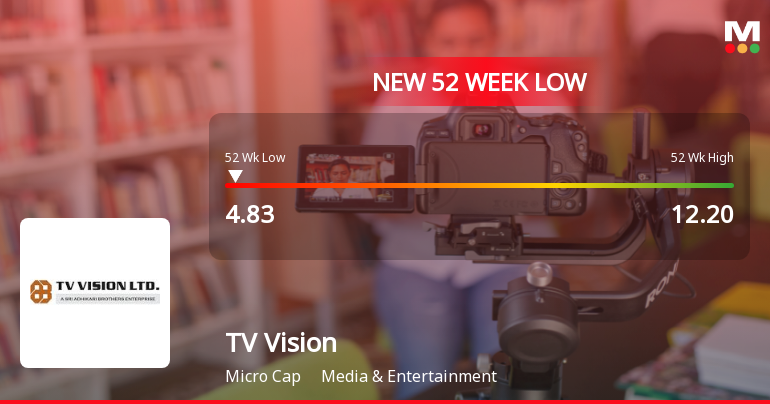
Announcements
Closure of Trading Window
15-Jun-2026 | Source : BSEIntimation of Closure of Trading Window
Announcement Under Regulation 30 (LODR)- General Updates
05-Jun-2026 | Source : BSEIntimation regarding receipt of copy of Petition filed by Operational Creditor under Section 9 of the Insolvency and Bankruptcy Code 2016
Results - Financial Results For FY 2025-2026
27-May-2026 | Source : BSEFinancial Results for FY 2025-2026
Corporate Actions

No Upcoming Board Meetings

No Dividend history available

No Splits history available

No Bonus history available

No Rights history available
Quality key factors
Valuation key factors
Technicals key factors
 Technical Indicator Scale: Bearish, Mildly Bearish, Sideways, Mildly Bullish, Bullish Turned
 Shareholding Snapshot : Mar 2026
Shareholding Compare (%holding)
Non Institution
49.8107
Held by 2 Schemes (0.0%)
Held by 2 FIIs (0.0%)
Sri Adhikari Brothers Assets Holding Private Limited (9.81%)
Aranav Trading And Investments Pvt Ltd (5.98%)
42.81%
Quarterly Results Snapshot (Consolidated) - Mar'26 - YoY

YoY Growth in quarter ended Mar 2026 is -98.35% vs -36.59% in Mar 2025
YoY Growth in quarter ended Mar 2026 is -69.08% vs -42.65% in Mar 2025
Half Yearly Results Snapshot (Consolidated) - Sep'25
Growth in half year ended Sep 2025 is -60.74% vs 8.95% in Sep 2024

Growth in half year ended Sep 2025 is -23.72% vs -30.95% in Sep 2024
Nine Monthly Results Snapshot (Consolidated) - Dec'25
YoY Growth in nine months ended Dec 2025 is -68.30% vs 0.27% in Dec 2024
YoY Growth in nine months ended Dec 2025 is -12.29% vs -3.51% in Dec 2024
Annual Results Snapshot (Consolidated) - Mar'26
YoY Growth in year ended Mar 2026 is -73.42% vs -8.77% in Mar 2025
YoY Growth in year ended Mar 2026 is -28.98% vs -12.68% in Mar 2025
About TV Vision Ltd

Company Coordinates


