
Compare TVS Elec. with Similar Stocks
Dashboard
Strong ability to service debt as the company has a low Debt to EBITDA ratio of 2.75 times
Positive results in Mar 26
With ROCE of 2.1, it has a Expensive valuation with a 6.8 Enterprise value to Capital Employed
Despite the size of the company, domestic mutual funds hold only 0.02% of the company
Market Beating Performance
Total Returns (Price + Dividend) 
Latest dividend: 1 per share ex-dividend date: Aug-02-2024
Risk Adjusted Returns v/s
Returns Beta

News

TVS Electronics Ltd is Rated Hold
TVS Electronics Ltd is rated 'Hold' by MarketsMOJO, with this rating last updated on 25 June 2026. However, the analysis and financial metrics discussed here reflect the stock's current position as of 29 July 2026, providing investors with an up-to-date view of the company’s fundamentals, returns, and market performance.
Read full news articleWhen is the next results date for TVS Electronics Ltd?
The next results date for TVS Electronics Ltd is scheduled for 08 August 2026....
Read full news article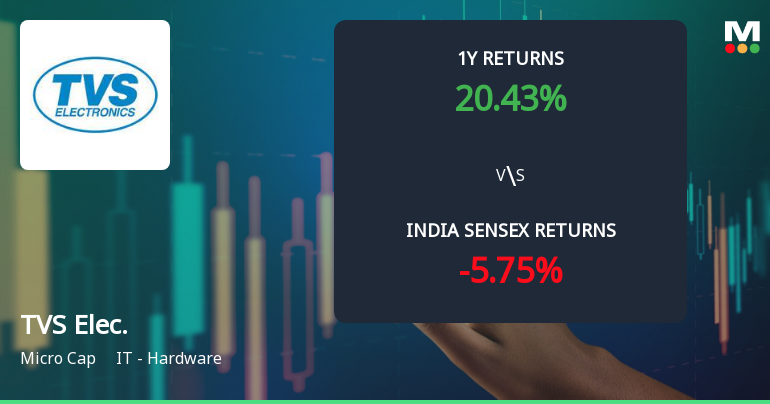
TVS Electronics Ltd Technical Momentum Shifts Amid Mixed Indicator Signals
TVS Electronics Ltd, a micro-cap player in the IT - Hardware sector, has experienced a nuanced shift in its technical momentum, reflecting a transition from bullish to mildly bullish trends. Despite a recent day decline of 2.93%, the stock’s technical indicators present a complex picture, with weekly and monthly signals diverging and suggesting cautious optimism for investors.
Read full news article Announcements
Intimation Under Regulation 30 Of SEBI (LODR) - Details Of Material Pending Litigation
24-Jul-2026 | Source : BSEIntimation under Reg 30 of SEBI (LODR)- Details of Material Pending Litigation
Intimation Under Regulation 30 Of SEBI (LODR) - Details Of Material Pending Litigation
24-Jul-2026 | Source : BSEIntimation under Reg 30 of SEBI (LODR)- Details of Material Pending Litigation
Board Meeting Intimation for Inter-Alia To Consider And Approve The Un-Audited Financial Results For The Quarter Ended 30Th June 2026
23-Jul-2026 | Source : BSETVS Electronics Ltdhas informed BSE that the meeting of the Board of Directors of the Company is scheduled on 08/08/2026 inter alia to consider and approve the Un-audited Financial Results for the Quarter ended 30th June 2026
Corporate Actions

08 Aug 2026

TVS Electronics Ltd has declared 10% dividend, ex-date: 02 Aug 24

No Splits history available

No Bonus history available

No Rights history available
Quality key factors
Valuation key factors
Technicals key factors
 Technical Indicator Scale: Bearish, Mildly Bearish, Sideways, Mildly Bullish, Bullish Turned
 Shareholding Snapshot : Jun 2026
Shareholding Compare (%holding)
Promoters
None
Held by 3 Schemes (0.01%)
Held by 4 FIIs (0.35%)
Gopal Srinivasan (59.71%)
Abhijit Periwal (1.74%)
31.37%
Quarterly Results Snapshot (Standalone) - Mar'26 - QoQ

QoQ Growth in quarter ended Mar 2026 is 3.36% vs -10.90% in Dec 2025
QoQ Growth in quarter ended Mar 2026 is 595.12% vs -73.55% in Dec 2025
Half Yearly Results Snapshot (Standalone) - Sep'25

Growth in half year ended Sep 2025 is 3.79% vs 18.80% in Sep 2024
Growth in half year ended Sep 2025 is 22.48% vs -279.17% in Sep 2024
Nine Monthly Results Snapshot (Standalone) - Dec'25
YoY Growth in nine months ended Dec 2025 is 6.92% vs 17.55% in Dec 2024
YoY Growth in nine months ended Dec 2025 is 50.77% vs -976.67% in Dec 2024
Annual Results Snapshot (Standalone) - Mar'26
YoY Growth in year ended Mar 2026 is 5.73% vs 17.67% in Mar 2025
YoY Growth in year ended Mar 2026 is 133.25% vs -1,503.70% in Mar 2025
About TVS Electronics Ltd

Company Coordinates


