
Compare TVS Srichakra with Similar Stocks
Dashboard
Low ability to service debt as the company has a high Debt to EBITDA ratio of 2.75 times
- Poor long term growth as Net Sales has grown by an annual rate of 13.44% and Operating profit at 1.85% over the last 5 years
- Low ability to service debt as the company has a high Debt to EBITDA ratio of 2.75 times
- The company has been able to generate a Return on Equity (avg) of 6.31% signifying low profitability per unit of shareholders funds
Poor long term growth as Net Sales has grown by an annual rate of 13.44% and Operating profit at 1.85% over the last 5 years
With a growth in Net Profit of 222.81%, the company declared Very Positive results in Mar 26
With ROCE of 7.1, it has a Fair valuation with a 2 Enterprise value to Capital Employed
Stock DNA
Tyres & Rubber Products
INR 3,170 Cr (Small Cap)
45.00
20
0.41%
0.63
5.87%
2.63
Total Returns (Price + Dividend) 
Latest dividend: 16.8 per share ex-dividend date: Sep-04-2025
Risk Adjusted Returns v/s
Returns Beta

News

TVS Srichakra Ltd is Rated Hold by MarketsMOJO
TVS Srichakra Ltd is rated 'Hold' by MarketsMOJO, with this rating last updated on 17 Feb 2026. However, all fundamentals, returns, and financial metrics discussed here reflect the stock's current position as of 12 July 2026, providing investors with an up-to-date analysis of the company’s performance and outlook.
Read full news article
TVS Srichakra Ltd is Rated Hold by MarketsMOJO
TVS Srichakra Ltd is rated 'Hold' by MarketsMOJO, with this rating last updated on 17 Feb 2026. However, the analysis and financial metrics discussed here reflect the stock's current position as of 01 July 2026, providing investors with an up-to-date view of its fundamentals, returns, and overall outlook.
Read full news article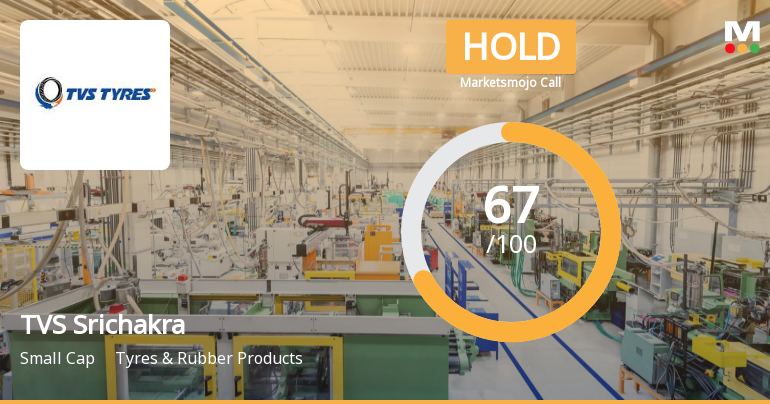
TVS Srichakra Ltd is Rated Hold by MarketsMOJO
TVS Srichakra Ltd is rated 'Hold' by MarketsMOJO, with this rating last updated on 17 February 2026. However, the analysis and financial metrics discussed here reflect the company’s current position as of 20 June 2026, providing investors with an up-to-date perspective on the stock’s fundamentals, valuation, financial trends, and technical outlook.
Read full news article Announcements
TVS Srichakra Limited - Reply to Clarification Sought
27-Nov-2019 | Source : NSETVS Srichakra Limitedmited with respect to announcement dated 13-Nov-2019, regardingá 'Intimation under the SEBI (Listing Obligation and Disclosure Requirements) Regulations, 2015'. On basis of above the Company is required to clarify following: 1. Name of the target entity, details in brief such as size, turnover etc; 2. Whether the acquisition would fall within related party transactions and whether the promoter/ promoter group/ group companies have any interest in the entity being acquired? If yes, nature of interest and details thereof and whether the same is done at "arm's length"; 3. Industry to which the entity being acquired belongs; 4. Objects and effects of acquisition (including but not limited to, disclosure of reasons for acquisition of target entity, if its business is outside the main line of business of the listed entity); 5. Brief details of any governmental or regulatory approvals required for the acquisition; 6. Indicative time period for completion of the acquisition; 7. Cost of acquisition or the price at which the shares are acquired; 8. Nature of consideration - whether cash consideration or share swap and details of the same; 9. Brief background about the entity acquired in terms of products/line of business acquired, date of incorporation, history of last 3 years turnover, country in which the acquired entity has presence and any other significant information (in brief). The response of the Company is attached.á
TVS Srichakra Limited - Clarification
21-Nov-2019 | Source : NSETVS Srichakra Limited with respect to announcement dated 13-Nov-2019, regardingá 'Intimation under the SEBI (Listing Obligation and Disclosure Requirements) Regulations, 2015'. On basis of above the Company is required to clarify following: 1. Name of the target entity, details in brief such as size, turnover etc;
TVS Srichakra Limited - Updates
18-Nov-2019 | Source : NSETVS Srichakra Limited has informed the Exchange regarding 'Sub: Publication of Unaudited Financial Results quarter ended 30.9.2019
Corporate Actions

No Upcoming Board Meetings

TVS Srichakra Ltd has declared 168% dividend, ex-date: 04 Sep 25

No Splits history available

No Bonus history available

No Rights history available
Quality key factors
Valuation key factors
Technicals key factors
 Technical Indicator Scale: Bearish, Mildly Bearish, Sideways, Mildly Bullish, Bullish Turned
 Shareholding Snapshot : Jun 2026
Shareholding Compare (%holding)
Non Institution
None
Held by 4 Schemes (6.02%)
Held by 39 FIIs (0.92%)
Tvs Mobility Private Limited (37.52%)
Quant Mutual Fund (5%)
35.38%
Quarterly Results Snapshot (Consolidated) - Mar'26 - QoQ

QoQ Growth in quarter ended Mar 2026 is 7.03% vs -1.08% in Dec 2025
QoQ Growth in quarter ended Mar 2026 is 223.68% vs 0.36% in Dec 2025
Half Yearly Results Snapshot (Consolidated) - Sep'25

Growth in half year ended Sep 2025 is 6.93% vs 13.24% in Sep 2024
Growth in half year ended Sep 2025 is 41.20% vs -71.72% in Sep 2024
Nine Monthly Results Snapshot (Consolidated) - Dec'25
YoY Growth in nine months ended Dec 2025 is 9.32% vs 12.72% in Dec 2024
YoY Growth in nine months ended Dec 2025 is 218.87% vs -86.91% in Dec 2024
Annual Results Snapshot (Consolidated) - Mar'26
YoY Growth in year ended Mar 2026 is 11.97% vs 11.20% in Mar 2025
YoY Growth in year ended Mar 2026 is 245.61% vs -80.91% in Mar 2025
About TVS Srichakra Ltd

Company Coordinates


