
Compare TVS Supply with Similar Stocks
Dashboard
Weak Long Term Fundamental Strength with an average Return on Capital Employed (ROCE) of 4.88%
- Poor long term growth as Net Sales has grown by an annual rate of 2.86% over the last 5 years
- Company's ability to service its debt is weak with a poor EBIT to Interest (avg) ratio of 0.92
Flat results in Mar 26
With ROCE of 5.2, it has a Attractive valuation with a 2 Enterprise value to Capital Employed
31.87% of Promoter Shares are Pledged
Stock DNA
Transport Services
INR 6,315 Cr (Small Cap)
33.00
39
0.00%
1.00
9.20%
3.09
Total Returns (Price + Dividend) 
TVS Supply for the last several years.
Risk Adjusted Returns v/s
Returns Beta

News
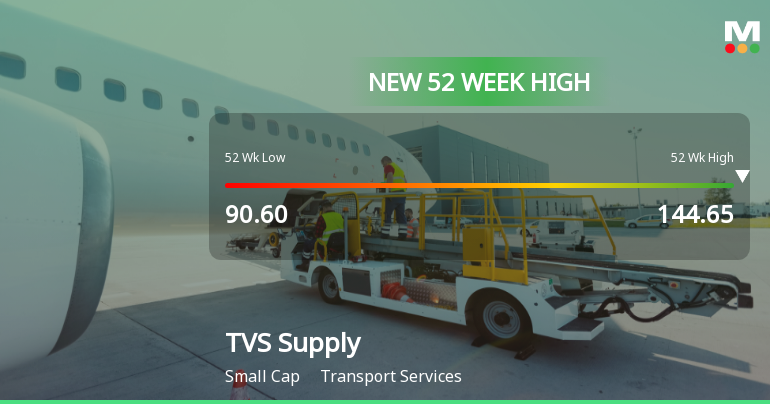
Broad-Based Technical Strength Lifts TVS Supply Chain Solutions Ltd to 52-Week High of Rs 144.65
Surpassing its previous peak, TVS Supply Chain Solutions Ltd touched a fresh 52-week high of Rs 144.65 on 10 Jul 2026, marking a significant milestone in its price momentum. This advance comes amid a backdrop of sustained technical strength and a market environment where the Sensex is also trading positively, reinforcing the stock’s upward trajectory.
Read full news article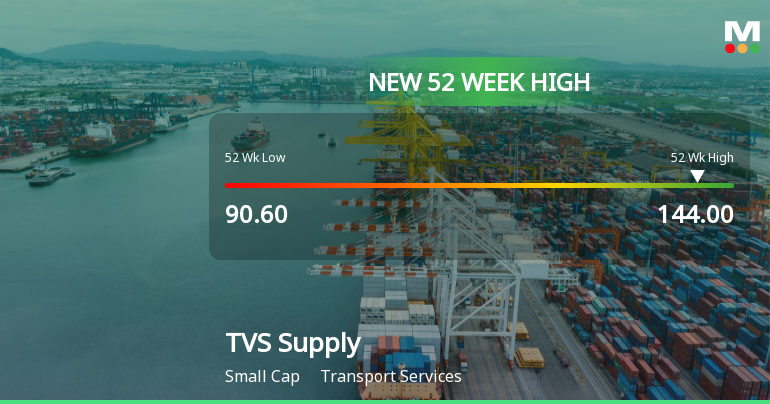
Broad-Based Technical Strength Lifts TVS Supply Chain Solutions Ltd to 52-Week High of Rs 144
With a decisive surge to Rs 144 on 7 Jul 2026, TVS Supply Chain Solutions Ltd has reached a fresh 52-week high, marking a notable milestone in its price momentum. This advance comes amid a backdrop of strong technical signals and sustained outperformance relative to its sector and the broader market.
Read full news article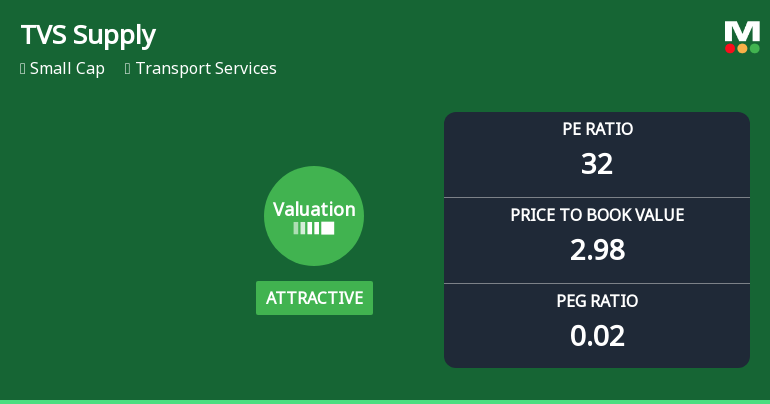
TVS Supply Chain Solutions Ltd: Valuation Shifts Signal Renewed Price Attractiveness
TVS Supply Chain Solutions Ltd has witnessed a notable improvement in its valuation parameters, shifting from a very attractive to an attractive rating. This change reflects a more favourable price-to-earnings (P/E) and price-to-book value (P/BV) positioning relative to its historical averages and peer group, signalling enhanced price attractiveness for investors within the transport services sector.
Read full news article Announcements
Corporate Actions

No Upcoming Board Meetings

No Dividend history available

No Splits history available

No Bonus history available

No Rights history available
Quality key factors
Valuation key factors
Technicals key factors
 Technical Indicator Scale: Bearish, Mildly Bearish, Sideways, Mildly Bullish, Bullish Turned
 Shareholding Snapshot : Mar 2026
Shareholding Compare (%holding)
Non Institution
31.8662
Held by 6 Schemes (0.12%)
Held by 49 FIIs (2.45%)
Tvs Mobility Private Limited (24.32%)
Lingotto Alternative Investments Master Fund Icav - Lingotto Special Opportunities Master Fund (9.65%)
20.26%
Quarterly Results Snapshot (Consolidated) - Mar'26 - QoQ

QoQ Growth in quarter ended Mar 2026 is 11.65% vs 2.00% in Dec 2025
QoQ Growth in quarter ended Mar 2026 is 63.71% vs -31.46% in Dec 2025
Half Yearly Results Snapshot (Consolidated) - Sep'25

Growth in half year ended Sep 2025 is 4.01% vs 10.99% in Sep 2024
Growth in half year ended Sep 2025 is 443.68% vs 113.75% in Sep 2024
Nine Monthly Results Snapshot (Consolidated) - Dec'25
YoY Growth in nine months ended Dec 2025 is 6.32% vs 10.68% in Dec 2024
YoY Growth in nine months ended Dec 2025 is 1,195.47% vs 91.63% in Dec 2024
Annual Results Snapshot (Consolidated) - Mar'26
YoY Growth in year ended Mar 2026 is 10.08% vs 8.65% in Mar 2025
YoY Growth in year ended Mar 2026 is 940.91% vs 86.57% in Mar 2025
About TVS Supply Chain Solutions Ltd

Company Coordinates


