
Compare Tyroon Tea Co. with Similar Stocks
Dashboard
With a Operating Losses, the company has a Weak Long Term Fundamental Strength
- Company's ability to service its debt is weak with a poor EBIT to Interest (avg) ratio of 1.31
- The company has been able to generate a Return on Equity (avg) of 9.79% signifying low profitability per unit of shareholders funds
Flat results in Mar 26
Risky - Negative EBITDA
Total Returns (Price + Dividend) 
Latest dividend: 1.0000 per share ex-dividend date: Sep-17-2014
Risk Adjusted Returns v/s
Returns Beta

News
Are Tyroon Tea Company Ltd latest results good or bad?
Tyroon Tea Company Ltd's latest financial results for Q4 FY26 indicate significant operational challenges. The company reported net sales of ₹2.14 crores, which represents a dramatic sequential decline of 84.35% from ₹13.67 crores in the previous quarter (Q3 FY26). Year-on-year, this figure also reflects a decline of 42.01% from ₹3.69 crores in Q4 FY25. The net loss for the quarter deepened to ₹5.82 crores, contrasting sharply with a modest profit of ₹0.11 crores in Q3 FY26. This resulted in an operating margin of -285.51%, a stark deterioration from the positive margin of 1.61% in the prior quarter. The company's cost structure appears misaligned with its revenue generation capabilities, as employee costs of ₹3.75 crores exceeded total revenue by 75%, indicating a fundamentally unsustainable economic situation. For the full fiscal year FY25, Tyroon Tea reported net sales of ₹41.00 crores, which remained...
Read full news article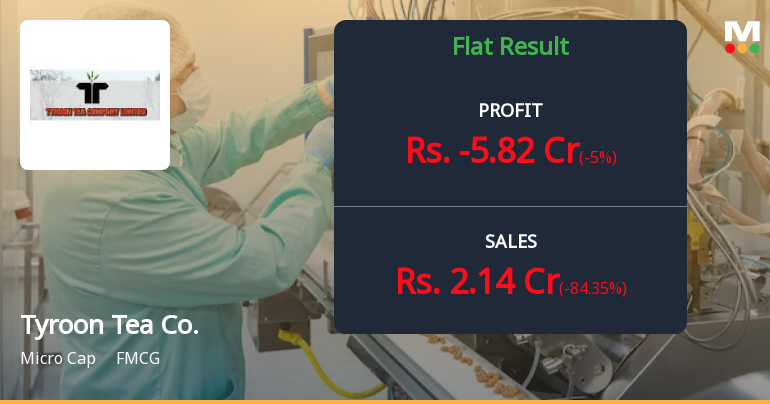
Tyroon Tea Company Q4 FY26: Steep Losses Deepen as Operational Woes Mount
Tyroon Tea Company Limited reported a deeply concerning fourth quarter for FY26, posting a net loss of ₹5.82 crores compared to a loss of ₹6.77 crores in Q4 FY25. Whilst this represents a marginal 14.03% improvement year-on-year, the sequential deterioration from a profitable Q3 FY26 (₹3.27 crores profit) paints a troubling picture of operational instability. The micro-cap FMCG company, with a market capitalisation of just ₹32.00 crores, saw its stock trade at ₹92.29 on May 29, down 33.05% from its 52-week high of ₹137.85.
Read full news article
Tyroon Tea Company Ltd is Rated Strong Sell
Tyroon Tea Company Ltd is rated Strong Sell by MarketsMOJO, with this rating last updated on 11 Aug 2025. However, the analysis and financial metrics discussed here reflect the stock’s current position as of 27 May 2026, providing investors with an up-to-date view of the company’s fundamentals, valuation, financial trends, and technical outlook.
Read full news article Announcements
Results-Financial Results For March 31 2026
29-May-2026 | Source : BSEAs per regilation 33 of SEBI (LODR) we are submitting herewith Audited Standalone Financial Results for the Quarter and Year ended 31st March 2026 along with Auditors Report.
Compliances-Reg.24(A)-Annual Secretarial Compliance
29-May-2026 | Source : BSEWe are submitting herewith Annual Secretarial Report pursuant to Regulation 24(A) of SEBI (LODR) Regulation 2015 for the Year ended 31st March 26
Board Meeting Intimation for To Consider Audited Financial Results For The 4Th Quarter And Year Ended 31-03-2026
21-May-2026 | Source : BSETyroon Tea Company Ltdhas informed BSE that the meeting of the Board of Directors of the Company is scheduled on 29/05/2026 inter alia to consider and approve Pursuant to Regulation 29 read with Regulation 47 of the SEBI (Listing Obligation and Disclosure Requirements) Regulation 2015 the meeting of the Board of Directors of the Company is scheduled to be held on Friday the 29th May 2026 at its registered office at 3.30 P.M. to consider inter alia Audited Financial Result for the 4th Quarter and Year ended 31st March 2026.
Corporate Actions

No Upcoming Board Meetings

Tyroon Tea Company Ltd has declared 10% dividend, ex-date: 17 Sep 14

No Splits history available

No Bonus history available

No Rights history available
Quality key factors
Valuation key factors
Technicals key factors
 Technical Indicator Scale: Bearish, Mildly Bearish, Sideways, Mildly Bullish, Bullish Turned
 Shareholding Snapshot : Mar 2026
Shareholding Compare (%holding)
Promoters
None
Held by 2 Schemes (0.01%)
Held by 0 FIIs
Anirudha Jalan (32.07%)
Rathinasamy Narayanasamy Rubesh (3.86%)
28.88%
Quarterly Results Snapshot (Standalone) - Mar'26 - QoQ

QoQ Growth in quarter ended Mar 2026 is -84.35% vs 1.18% in Dec 2025
QoQ Growth in quarter ended Mar 2026 is -5,390.91% vs -96.64% in Dec 2025
Half Yearly Results Snapshot (Standalone) - Sep'25
Growth in half year ended Sep 2025 is -19.33% vs -12.60% in Sep 2024
Growth in half year ended Sep 2025 is -60.52% vs -5.76% in Sep 2024
Nine Monthly Results Snapshot (Standalone) - Dec'25
YoY Growth in nine months ended Dec 2025 is -12.42% vs -3.35% in Dec 2024
YoY Growth in nine months ended Dec 2025 is -65.58% vs 5.11% in Dec 2024
Annual Results Snapshot (Standalone) - Mar'26
YoY Growth in year ended Mar 2026 is -15.11% vs -0.70% in Mar 2025
YoY Growth in year ended Mar 2026 is -171.00% vs 10.70% in Mar 2025
About Tyroon Tea Company Ltd

Company Coordinates


