
Compare U. H. Zaveri with Similar Stocks
Dashboard
Weak Long Term Fundamental Strength with a -16.60% CAGR growth in Operating Profits over the last 5 years
- Low ability to service debt as the company has a high Debt to EBITDA ratio of 8.49 times
- The company has been able to generate a Return on Equity (avg) of 5.56% signifying low profitability per unit of shareholders funds
With ROCE of 0.2, it has a Expensive valuation with a 1.7 Enterprise value to Capital Employed
Stock DNA
Gems, Jewellery And Watches
INR 39 Cr (Micro Cap)
663.00
46
0.00%
0.43
0.31%
2.09
Total Returns (Price + Dividend) 
Latest dividend: 0.10000000000000002 per share ex-dividend date: Sep-19-2018
Risk Adjusted Returns v/s
Returns Beta

News

U. H. Zaveri Ltd Valuation Shifts to Fair Amidst Mixed Market Performance
U. H. Zaveri Ltd has experienced a notable shift in its valuation parameters, moving from an expensive to a fair valuation grade despite persistent challenges in the gems and jewellery sector. This article analyses the recent changes in key valuation metrics such as price-to-earnings (P/E) and price-to-book value (P/BV) ratios, contrasting them with historical trends and peer benchmarks to assess the stock’s current price attractiveness.
Read full news article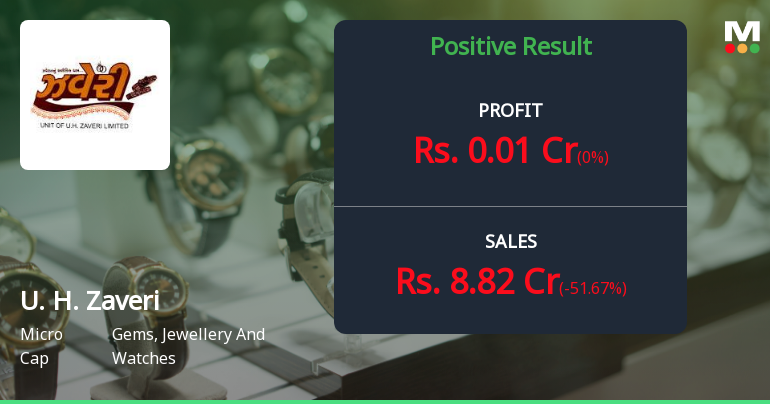
U. H. Zaveri Q4 FY26: Profitability Margins Collapse Amid Revenue Volatility
U. H. Zaveri Ltd., the Ahmedabad-based jewellery retailer, posted a net profit of ₹0.01 crores in Q4 FY26, reflecting extreme margin compression despite revenue growth. The ₹42.00 crore market cap company saw its profit after tax margin shrink to a meagre 0.11% from 0.60% in the previous quarter, raising serious concerns about operational efficiency and cost management. The stock has responded positively to the broader annual performance, gaining 3.68% to ₹14.10 following the results announcement.
Read full news article
U. H. Zaveri Ltd is Rated Sell
U. H. Zaveri Ltd is rated 'Sell' by MarketsMOJO, with this rating last updated on 17 Nov 2025. However, the analysis and financial metrics discussed here reflect the stock's current position as of 20 May 2026, providing investors with an up-to-date view of the company's fundamentals, valuation, financial trends, and technical outlook.
Read full news article Announcements
Compliances-Reg.24(A)-Annual Secretarial Compliance
30-May-2026 | Source : BSEAnnual Secretarial Compliance Report of U H Zaveri Limited as on 31st March 2026
Board Meeting Outcome for Outcome Of The Meeting Of Board Of Directors Of The Company Held On May 29Th 2026.
29-May-2026 | Source : BSEThe Board of Directors of the U H Zaveri Limited in their meeting held on today 29th May 2026 has considered and approved Audited Financial Result for the quarter and financial year ended 31st March 2026 along with Audit Report as attached
Results- Financial Results For March 31 2026
29-May-2026 | Source : BSEThe Board has considered and approved Audited Financial result along with Audit Report for the quarter and financial year ended 31st March 2026 as attached
Corporate Actions

No Upcoming Board Meetings

U. H. Zaveri Ltd has declared 1% dividend, ex-date: 19 Sep 18

No Splits history available

U. H. Zaveri Ltd has announced 2:3 bonus issue, ex-date: 19 Oct 22

U. H. Zaveri Ltd has announced 2:1 rights issue, ex-date: 03 Oct 25
Quality key factors
Valuation key factors
Technicals key factors
 Technical Indicator Scale: Bearish, Mildly Bearish, Sideways, Mildly Bullish, Bullish Turned
 Shareholding Snapshot : Mar 2026
Shareholding Compare (%holding)
Non Institution
None
Held by 0 Schemes
Held by 0 FIIs
Hitesh Mahendrakumar Shah (38.41%)
Vivid Mercantile Limited (19.45%)
21.78%
Quarterly Results Snapshot (Standalone) - Mar'26 - QoQ

QoQ Growth in quarter ended Mar 2026 is -51.67% vs 69.29% in Dec 2025

QoQ Growth in quarter ended Mar 2026 is 0.00% vs -50.00% in Dec 2025
Half Yearly Results Snapshot (Standalone) - Sep'25
Growth in half year ended Sep 2025 is 33.93% vs 69.63% in Sep 2024
Growth in half year ended Sep 2025 is -78.95% vs -70.31% in Sep 2024
Nine Monthly Results Snapshot (Standalone) - Dec'25
YoY Growth in nine months ended Dec 2025 is 24.84% vs 25.29% in Dec 2024
YoY Growth in nine months ended Dec 2025 is -76.19% vs -87.04% in Dec 2024
Annual Results Snapshot (Standalone) - Mar'26
YoY Growth in year ended Mar 2026 is 37.24% vs 56.97% in Mar 2025
YoY Growth in year ended Mar 2026 is -76.19% vs -67.69% in Mar 2025
About U. H. Zaveri Ltd

Company Coordinates


