
Compare U. Y. Fincorp with Similar Stocks
Stock DNA
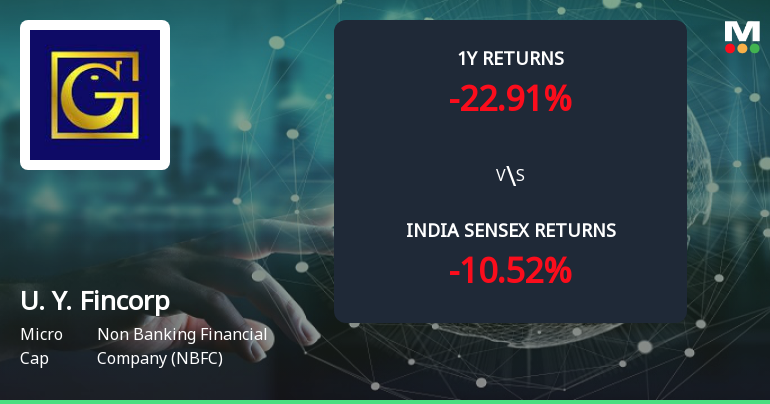
Non Banking Financial Company (NBFC)
INR 270 Cr (Micro Cap)
6.00
20
0.00%
0.01
12.41%
0.69
Total Returns (Price + Dividend) 
Latest dividend: 0.05 per share ex-dividend date: Sep-18-2018
Risk Adjusted Returns v/s
Returns Beta

News
Golden Cross Forms in U. Y. Fincorp Ltd Amid Mixed Technical Signals and Modest Price Movement
The 50-day moving average has crossed above the 200-day moving average for U. Y. Fincorp Ltd, signalling a golden cross on 11 Jun 2026. Yet, the stock’s slight decline of 0.14% on the day and a mixed technical backdrop suggest this signal warrants a cautious interpretation rather than an outright bullish endorsement.
Read full news article
U. Y. Fincorp Ltd Downgraded to Sell Amid Mixed Financial and Technical Signals
U. Y. Fincorp Ltd, a micro-cap player in the Non Banking Financial Company (NBFC) sector, has seen its investment rating downgraded from Hold to Sell as of 8 June 2026. This revision reflects a complex interplay of factors across quality, valuation, financial trends, and technical indicators, signalling caution for investors despite some recent operational improvements.
Read full news article
U. Y. Fincorp Ltd Upgraded to Hold on Strong Financial and Technical Improvements
U. Y. Fincorp Ltd, a micro-cap player in the Non Banking Financial Company (NBFC) sector, has seen its investment rating upgraded from Sell to Hold as of 1 June 2026. This change reflects significant improvements across financial performance, valuation metrics, and technical indicators, signalling a more stable outlook for investors despite some lingering challenges.
Read full news article Announcements
Announcement under Regulation 30 (LODR)-Newspaper Publication
29-May-2026 | Source : BSECopy of newspaper publications with respect to Standalone Audited Financial Results for the quarter and financial year ended 31st March 2026.
Compliances-Reg.24(A)-Annual Secretarial Compliance
28-May-2026 | Source : BSEAnnual Secretarial Compliance Report for the financial year 2025-26.
Announcement under Regulation 30 (LODR)-Press Release / Media Release
28-May-2026 | Source : BSECopy of Newspaper Publication
Corporate Actions

No Upcoming Board Meetings

U. Y. Fincorp Ltd has declared 1% dividend, ex-date: 18 Sep 18

U. Y. Fincorp Ltd has announced 5:10 stock split, ex-date: 03 May 12

No Bonus history available

U. Y. Fincorp Ltd has announced 9:5 rights issue, ex-date: 18 Mar 14
Quality key factors
Valuation key factors
Technicals key factors
 Technical Indicator Scale: Bearish, Mildly Bearish, Sideways, Mildly Bullish, Bullish Turned
 Shareholding Snapshot : Mar 2026
Shareholding Compare (%holding)
Promoters
None
Held by 0 Schemes
Held by 2 FIIs (0.06%)
Udai Kothari (23.21%)
Main Land Finance Pvt. Ltd. (2.21%)
20.66%
Quarterly Results Snapshot (Standalone) - Mar'26 - QoQ

QoQ Growth in quarter ended Mar 2026 is 62.46% vs 45.12% in Dec 2025

QoQ Growth in quarter ended Mar 2026 is 3.93% vs 107.42% in Dec 2025
Half Yearly Results Snapshot (Standalone) - Sep'25
Growth in half year ended Sep 2025 is -43.42% vs 62.38% in Sep 2024
Growth in half year ended Sep 2025 is 64.44% vs -84.59% in Sep 2024
Nine Monthly Results Snapshot (Standalone) - Dec'25
YoY Growth in nine months ended Dec 2025 is -15.04% vs 15.88% in Dec 2024
YoY Growth in nine months ended Dec 2025 is 189.85% vs -82.33% in Dec 2024
Annual Results Snapshot (Standalone) - Mar'26
YoY Growth in year ended Mar 2026 is 25.33% vs -8.87% in Mar 2025
YoY Growth in year ended Mar 2026 is 311.59% vs -81.93% in Mar 2025
About U. Y. Fincorp Ltd

Company Coordinates


