
Compare Uber Technologies, Inc. with Similar Stocks
Dashboard
With a growth in Operating Profit of 51.16%, the company declared Outstanding results in Jun 25
- The company has declared positive results for the last 16 consecutive quarters
- OPERATING CASH FLOW(Y) Highest at USD 8,789 MM
- INTEREST COVERAGE RATIO(Q) Highest at 1,527.78
- ROCE(HY) Highest at 72.26%
With ROCE of 18.56%, it has a very attractive valuation with a 7.44 Enterprise value to Capital Employed
Market Beating Performance
Stock DNA
Transport Services
USD 175,078 Million (Large Cap)
17.00
NA
0.00%
0.08
56.39%
6.22
Total Returns (Price + Dividend) 
Uber Technologies, Inc. for the last several years.
Risk Adjusted Returns v/s
News
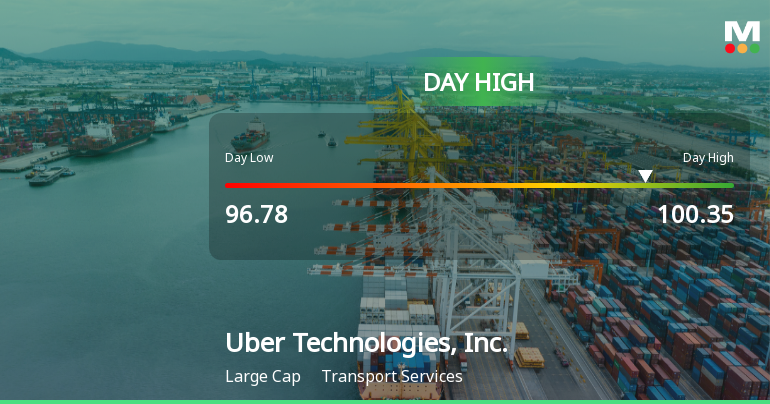
Uber Technologies Hits Day High with Strong 3.34% Intraday Surge
Uber Technologies, Inc. has shown significant growth, with a year-to-date increase of 65.32% and a 247.09% rise over three years. The company reported a 51.16% surge in operating profit and strong financial metrics, including an operating cash flow of USD 8,789 million and a high interest coverage ratio.
Read full news article Announcements

Corporate Actions
Quality key factors
Valuation key factors
Technicals key factors
 Technical Indicator Scale: Bearish, Mildly Bearish, Sideways, Mildly Bullish, Bullish Turned
 Shareholding Snapshot : Sep 2025
Shareholding Compare (%holding)
Domestic Funds
Held in 230 Schemes (35.37%)
Held by 673 Foreign Institutions (21.74%)
Quarterly Results Snapshot (Consolidated) - Jun'25 - YoY

YoY Growth in quarter ended Jun 2025 is 18.23% vs 15.93% in Jun 2024

YoY Growth in quarter ended Jun 2025 is 33.93% vs 155.84% in Jun 2024
Annual Results Snapshot (Consolidated) - Dec'24
YoY Growth in year ended Dec 2024 is 17.96% vs 16.95% in Dec 2023
YoY Growth in year ended Dec 2024 is 356.63% vs 123.59% in Dec 2023
About Uber Technologies, Inc.

Company Coordinates


