
Compare Uday Jewellery with Similar Stocks
Dashboard
Healthy long term growth as Net Sales has grown by an annual rate of 48.70% and Operating profit at 40.29%
With a growth in Net Profit of 488.95%, the company declared Outstanding results in Mar 26
With ROCE of 10.9, it has a Attractive valuation with a 1.8 Enterprise value to Capital Employed
Stock DNA
Gems, Jewellery And Watches
INR 499 Cr (Micro Cap)
17.00
44
0.00%
0.76
14.68%
2.46
Total Returns (Price + Dividend) 
Uday Jewellery for the last several years.
Risk Adjusted Returns v/s
Returns Beta

News
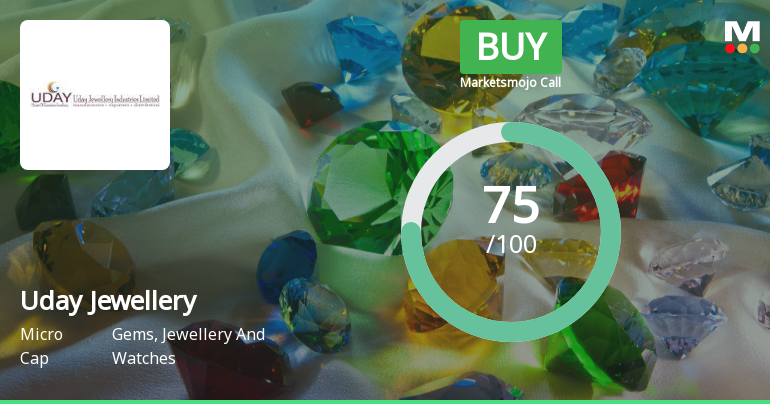
Uday Jewellery Industries Ltd Upgraded to Buy on Strong Financial and Technical Signals
Uday Jewellery Industries Ltd has been upgraded from a Hold to a Buy rating, reflecting a marked improvement across key investment parameters including quality, valuation, financial trends, and technical indicators. This upgrade follows the company’s robust quarterly performance, favourable long-term growth prospects, and a shift towards a more bullish technical outlook.
Read full news article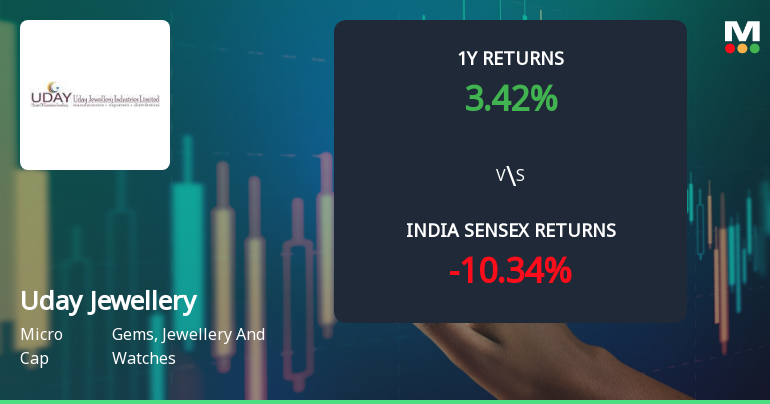
Uday Jewellery Industries Ltd Sees Technical Momentum Shift Amid Mixed Indicator Signals
Uday Jewellery Industries Ltd has demonstrated a notable shift in price momentum, transitioning from a sideways trend to a mildly bullish stance, supported by a range of technical indicators. The stock’s recent upgrade from a Hold to a Buy rating by MarketsMOJO, alongside a Mojo Score of 75.0, reflects growing investor confidence in this micro-cap player within the Gems, Jewellery and Watches sector.
Read full news article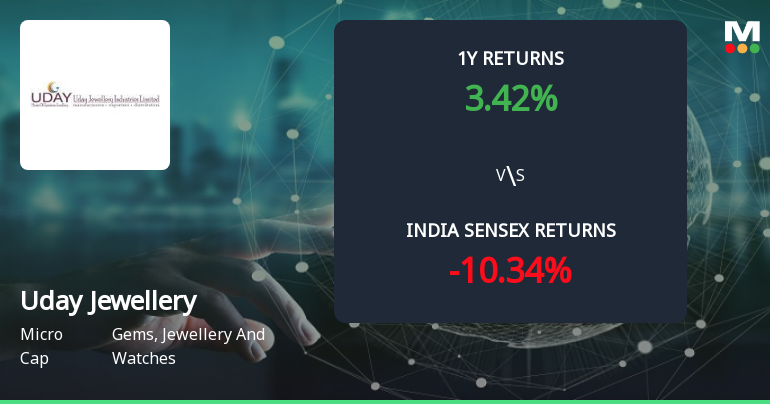
Golden Cross Forms in Uday Jewellery Industries Ltd — On a Day the Stock Gained 2.09%. What the Mixed Signals Mean
The 50-day moving average has crossed above the 200-day moving average for Uday Jewellery Industries Ltd, signalling a golden cross on 9 Jun 2026. However, the broader technical and fundamental context presents a nuanced picture that tempers the enthusiasm this crossover might typically generate.
Read full news article Announcements
Announcement under Regulation 30 (LODR)-Newspaper Publication
29-May-2026 | Source : BSENewspaper Publication for Audited Financial Results for period ended on 31-03-2026.
Announcement under Regulation 30 (LODR)-Press Release / Media Release
28-May-2026 | Source : BSEPlease find enclosed the press release for Audited financial Results for Quarter and Year Ended on 31-03-2026
Board Meeting Outcome for For Meeting Held On 28-05-2026
28-May-2026 | Source : BSEOutcome of Board meeting for approval of Audited Financial Results for Quarter and year ended on 31-03-2026 and declaration of Dividend for FY2025-26.
Corporate Actions

No Upcoming Board Meetings

No Dividend history available

No Splits history available

No Bonus history available

No Rights history available
Quality key factors
Valuation key factors
Technicals key factors
 Technical Indicator Scale: Bearish, Mildly Bearish, Sideways, Mildly Bullish, Bullish Turned
 Shareholding Snapshot : May 2026
Shareholding Compare (%holding)
Promoters
None
Held by 0 Schemes
Held by 0 FIIs
Ritesh Kumar Sanghi (17.07%)
Rajesh Gupta (1.65%)
21.22%
Quarterly Results Snapshot (Standalone) - Mar'26 - YoY

YoY Growth in quarter ended Mar 2026 is 112.85% vs 154.16% in Mar 2025
YoY Growth in quarter ended Mar 2026 is 488.95% vs 2,916.67% in Mar 2025
Half Yearly Results Snapshot (Standalone) - Sep'25

Growth in half year ended Sep 2025 is 139.52% vs 35.30% in Sep 2024
Growth in half year ended Sep 2025 is 157.17% vs -7.99% in Sep 2024
Nine Monthly Results Snapshot (Standalone) - Dec'25
YoY Growth in nine months ended Dec 2025 is 123.13% vs 54.32% in Dec 2024
YoY Growth in nine months ended Dec 2025 is 101.02% vs 13.76% in Dec 2024
Annual Results Snapshot (Standalone) - Mar'26
YoY Growth in year ended Mar 2026 is 95.19% vs 114.67% in Mar 2025
YoY Growth in year ended Mar 2026 is 127.11% vs 80.83% in Mar 2025
About Uday Jewellery Industries Ltd

Company Coordinates


