
Compare Udayshivakumar with Similar Stocks
Dashboard
Weak Long Term Fundamental Strength with a -38.42% CAGR growth in Operating Profits over the last 5 years
- The company has been able to generate a Return on Equity (avg) of 7.32% signifying low profitability per unit of shareholders funds
Below par performance in long term as well as near term
Total Returns (Price + Dividend) 
Udayshivakumar for the last several years.
Risk Adjusted Returns v/s
Returns Beta

News

Udayshivakumar Infra Ltd Upgraded to Sell on Improved Financials and Valuation
Udayshivakumar Infra Ltd has seen its investment rating upgraded from Strong Sell to Sell as of 9 June 2026, reflecting notable improvements in its financial performance and valuation metrics. Despite lingering challenges in sales and operational efficiency, the company’s recent quarterly results and valuation appeal have prompted a reassessment of its outlook by analysts.
Read full news article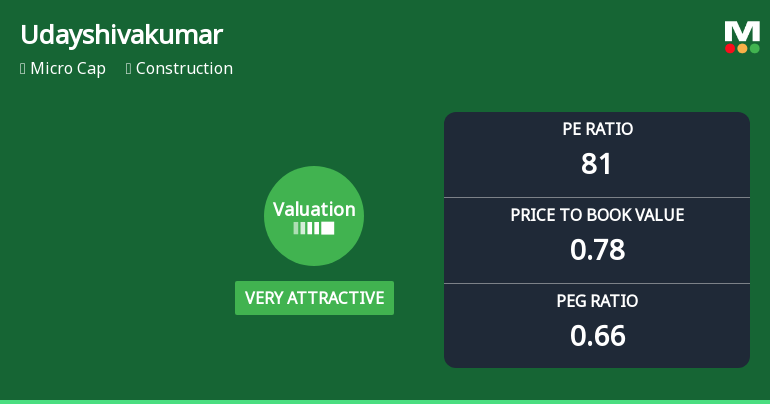
Udayshivakumar Infra Ltd Valuation Shifts Signal Renewed Price Attractiveness Amid Market Volatility
Udayshivakumar Infra Ltd has witnessed a significant shift in its valuation parameters, moving from a risky to a very attractive valuation grade. Despite a challenging market environment and a recent share price decline of 7.27% on 10 Jun 2026, the stock’s price-to-book value and other key metrics suggest a compelling entry point for investors willing to navigate its micro-cap status and subdued profitability.
Read full news article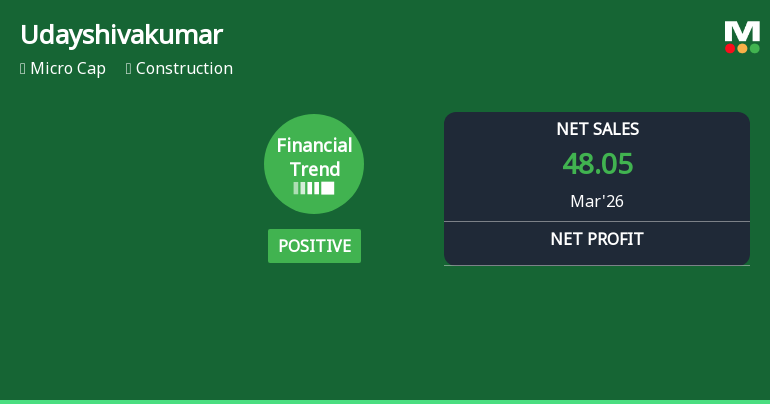
Udayshivakumar Infra Ltd Reports Strong Quarterly Profit Amid Revenue Decline
Udayshivakumar Infra Ltd, a micro-cap player in the construction sector, has demonstrated a notable financial turnaround in the quarter ended March 2026, shifting from a negative to a positive performance trend despite a significant drop in net sales. The company’s operating profitability and earnings per share have reached record highs, signalling operational improvements even as top-line challenges persist.
Read full news article Announcements
Announcement under Regulation 30 (LODR)-Newspaper Publication
08-Jun-2026 | Source : BSENewspaper Publication of the audited financial results for the quarter and financial year ended 31st March 2026.
Board Meeting Outcome for OUTCOME OF BOARD MEETING HELD ON 06-06-2026
06-Jun-2026 | Source : BSEOutcome of the meeting of board of directors of the company held on 06-06-2026 for approval of Audited Financial Results/Statements for the Quatere and Year ended 31st March 2026. Intimation for Board Meeting was filed on 01-06-2026. However due to technical error we are not able to select outcome with intimation.
Compliances-Reg. 50 (1) - Prior intimation about Board meeting under Regulation 50(1)
01-Jun-2026 | Source : BSEIntimation of the Board Meeting to be held on 06th June 2026.
Corporate Actions

No Upcoming Board Meetings

No Dividend history available

No Splits history available

No Bonus history available

No Rights history available
Quality key factors
Valuation key factors
Technicals key factors
 Technical Indicator Scale: Bearish, Mildly Bearish, Sideways, Mildly Bullish, Bullish Turned
 Shareholding Snapshot : Mar 2026
Shareholding Compare (%holding)
Promoters
None
Held by 0 Schemes
Held by 0 FIIs
Udayshivakumar (65.26%)
None
31.16%
Quarterly Results Snapshot (Standalone) - Mar'26 - QoQ

QoQ Growth in quarter ended Mar 2026 is 1.35% vs -17.85% in Dec 2025
QoQ Growth in quarter ended Mar 2026 is 378.71% vs -684.15% in Dec 2025
Half Yearly Results Snapshot (Standalone) - Sep'25
Growth in half year ended Sep 2025 is -12.14% vs -48.66% in Sep 2024

Growth in half year ended Sep 2025 is -180.89% vs -124.12% in Sep 2024
Nine Monthly Results Snapshot (Standalone) - Dec'25
YoY Growth in nine months ended Dec 2025 is -7.56% vs -57.72% in Dec 2024
YoY Growth in nine months ended Dec 2025 is -1,118.75% vs -105.91% in Dec 2024
Annual Results Snapshot (Standalone) - Mar'26
YoY Growth in year ended Mar 2026 is -26.91% vs -49.90% in Mar 2025
YoY Growth in year ended Mar 2026 is 123.02% vs -123.93% in Mar 2025
About Udayshivakumar Infra Ltd

Company Coordinates


