
Compare UDR, Inc. with Similar Stocks
Dashboard
Strong Long Term Fundamental Strength with a 0.43% CAGR growth in Operating Profits
Poor long term growth as Net Sales has grown by an annual rate of 6.58%
Positive results in Jun 25
With ROE of 5.19%, it has a very expensive valuation with a 4.08 Price to Book Value
Consistent Underperformance against the benchmark over the last 3 years
Total Returns (Price + Dividend) 
UDR, Inc. for the last several years.
Risk Adjusted Returns v/s
News
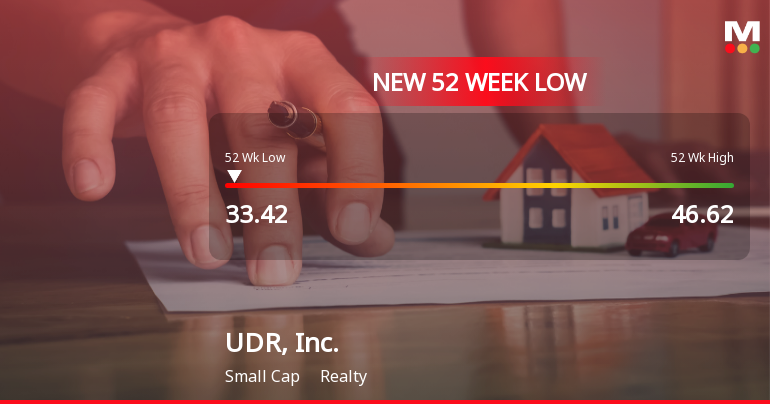
UDR, Inc. Hits 52-Week Low at $33.42 Amidst Market Decline
UDR, Inc. has reached a new 52-week low, reflecting a significant decline in its stock performance over the past year. The company, with a market capitalization of approximately USD 12.84 billion, faces challenges including a substantial profit drop and modest return on equity, despite strong operating cash flow.
Read full news article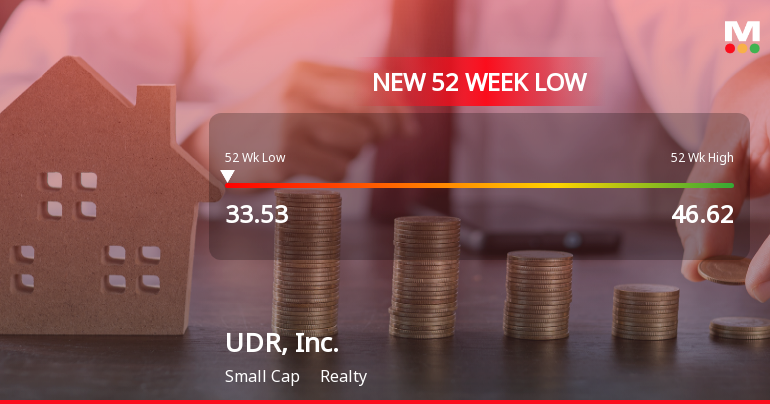
UDR, Inc. Hits 52-Week Low at $33.52 Amid Market Volatility
UDR, Inc. has reached a new 52-week low, reflecting a significant decline in its stock performance over the past year. The company has a market capitalization of USD 12,840 million, a high P/E ratio, and a notable dividend yield, despite facing challenges with declining net profits and modest ROE.
Read full news article Announcements

Corporate Actions
Quality key factors
Valuation key factors
Technicals key factors
 Technical Indicator Scale: Bearish, Mildly Bearish, Sideways, Mildly Bullish, Bullish Turned
 Shareholding Snapshot : Sep 2025
Shareholding Compare (%holding)
Domestic Funds
Held in 108 Schemes (43.98%)
Held by 280 Foreign Institutions (32.87%)
Quarterly Results Snapshot (Consolidated) - Jun'25 - YoY

YoY Growth in quarter ended Jun 2025 is 2.43% vs 2.67% in Jun 2024

YoY Growth in quarter ended Jun 2025 is 29.68% vs -91.63% in Jun 2024
Annual Results Snapshot (Consolidated) - Dec'24
YoY Growth in year ended Dec 2024 is 2.72% vs 7.26% in Dec 2023
YoY Growth in year ended Dec 2024 is -79.79% vs 412.42% in Dec 2023
About UDR, Inc.

Company Coordinates


