
Compare Ujaas Energy with Similar Stocks
Dashboard
With a Operating Losses, the company has a Weak Long Term Fundamental Strength
- Low ability to service debt as the company has a high Debt to EBITDA ratio of -6.14 times
- The company has been able to generate a Return on Capital Employed (avg) of 0.83% signifying low profitability per unit of total capital (equity and debt)
The company has declared negative results for the last 5 consecutive quarters
Risky - Negative EBITDA
Despite the size of the company, domestic mutual funds hold only 0% of the company
Total Returns (Price + Dividend) 
Latest dividend: 0.0077880000000000015 per share ex-dividend date: Sep-11-2017
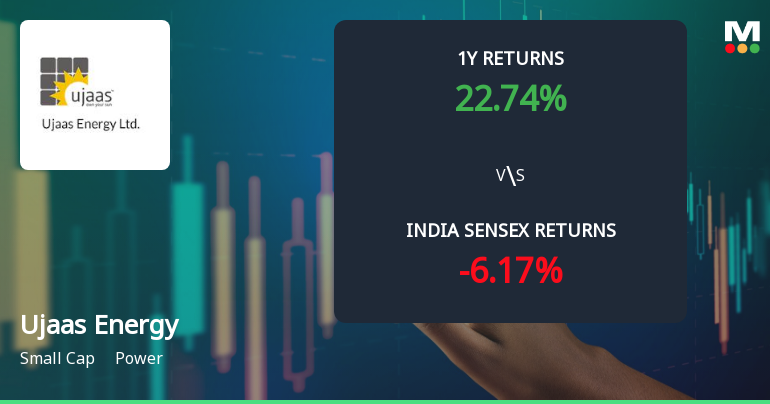
Risk Adjusted Returns v/s
Returns Beta

News
Ujaas Energy Ltd Technical Momentum Shifts Amid Mixed Market Signals
Ujaas Energy Ltd, a small-cap player in the power sector, has experienced a notable shift in its technical momentum, moving from a mildly bullish stance to a sideways trend. Despite a recent downgrade to a Strong Sell rating by MarketsMOJO, the stock’s technical indicators present a complex picture, with bearish signals dominating weekly charts but some mildly bullish signs emerging on monthly timeframes. This article analyses the latest price movements, technical indicators, and relative performance against the broader market to provide a comprehensive view for investors.
Read full news article
Ujaas Energy Ltd Technical Momentum Shifts Amid Mixed Indicator Signals
Ujaas Energy Ltd has exhibited a subtle shift in its technical momentum, moving from a sideways trend to a mildly bullish stance, despite a complex mix of indicator signals. The stock’s recent price action, combined with its technical parameters such as MACD, RSI, and moving averages, suggests cautious optimism amid lingering bearish undertones.
Read full news article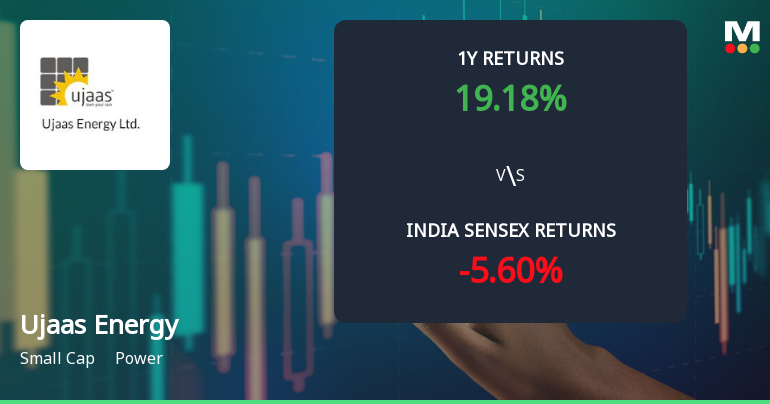
Ujaas Energy Ltd Technical Momentum Shifts Amid Mixed Market Signals
Ujaas Energy Ltd, a small-cap player in the power sector, has experienced a notable shift in its technical momentum, moving from a mildly bullish stance to a sideways trend. Despite a modest decline in its daily price, the stock’s technical indicators present a complex picture, with bearish signals on weekly and monthly MACD and KST, contrasted by mildly bullish daily moving averages and monthly Bollinger Bands. This article analyses these technical parameters in detail, providing investors with a comprehensive view of the stock’s current market positioning and outlook.
Read full news article Announcements
Announcement under Regulation 30 (LODR)-Newspaper Publication
23-Jun-2026 | Source : BSENewspaper Publication.
Announcement under Regulation 30 (LODR)-Change in Management
22-Jun-2026 | Source : BSEOutcome of board meeting held on 22.06.2026.
Reg. 34 (1) Annual Report.
22-Jun-2026 | Source : BSEAnnual Report for the financial year 2025-26.
Corporate Actions

No Upcoming Board Meetings

Ujaas Energy Ltd has declared 5% dividend, ex-date: 11 Sep 17

Ujaas Energy Ltd has announced 1:10 stock split, ex-date: 21 Dec 12

Ujaas Energy Ltd has announced 2:1 bonus issue, ex-date: 10 Oct 25

No Rights history available
Quality key factors
Valuation key factors
Technicals key factors
 Technical Indicator Scale: Bearish, Mildly Bearish, Sideways, Mildly Bullish, Bullish Turned
 Shareholding Snapshot : Mar 2026
Shareholding Compare (%holding)
Promoters
None
Held by 0 Schemes
Held by 0 FIIs
Sva Family Welfare Trust (represented By Vandana Mundra) (74.21%)
Swastika Fin Mart Private Limited (23.61%)
1.19%
Quarterly Results Snapshot (Standalone) - Mar'26 - YoY

YoY Growth in quarter ended Mar 2026 is -27.41% vs 13.60% in Mar 2025
YoY Growth in quarter ended Mar 2026 is 40.00% vs 107.25% in Mar 2025
Half Yearly Results Snapshot (Standalone) - Sep'25
Growth in half year ended Sep 2025 is -31.76% vs -21.72% in Sep 2024
Growth in half year ended Sep 2025 is -44.03% vs 137.33% in Sep 2024
Nine Monthly Results Snapshot (Standalone) - Dec'25
YoY Growth in nine months ended Dec 2025 is -42.64% vs -3.62% in Dec 2024

YoY Growth in nine months ended Dec 2025 is -67.92% vs -74.20% in Dec 2024
Annual Results Snapshot (Standalone) - Mar'26
YoY Growth in year ended Mar 2026 is -38.23% vs 0.79% in Mar 2025
YoY Growth in year ended Mar 2026 is -64.29% vs -69.44% in Mar 2025
About Ujaas Energy Ltd

Company Coordinates


