
Compare Ultramarine Pig. with Similar Stocks
Stock DNA
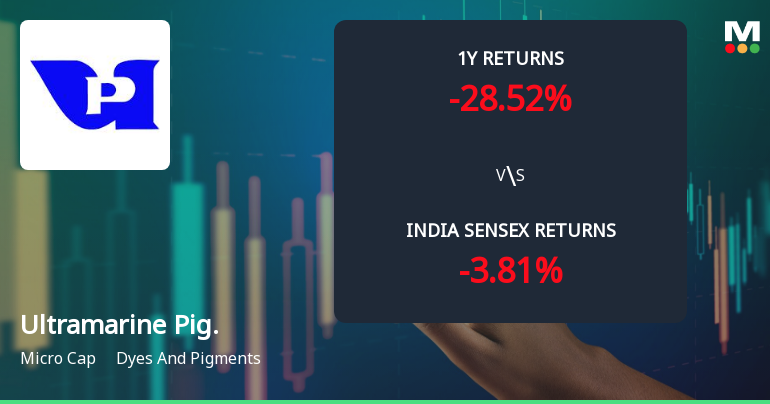
Dyes And Pigments
INR 1,128 Cr (Micro Cap)
14.00
20
1.56%
0.03
9.06%
1.29
Total Returns (Price + Dividend) 
Latest dividend: 6.000000000000001 per share ex-dividend date: Jul-14-2026
Risk Adjusted Returns v/s
Returns Beta

News
Ultramarine & Pigments Ltd Sees Mixed Technical Signals Amid Mild Momentum Shift
Ultramarine & Pigments Ltd has experienced a notable shift in its technical momentum, moving from a bearish stance to a mildly bearish outlook. Despite a 3.66% gain on the day, the stock’s mixed technical indicators and micro-cap status suggest cautious optimism amid broader market challenges.
Read full news article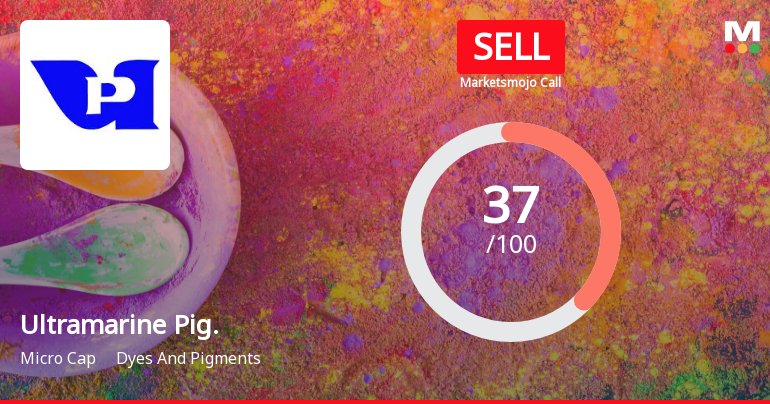
Ultramarine & Pigments Ltd is Rated Sell
Ultramarine & Pigments Ltd is rated 'Sell' by MarketsMOJO. This rating was last updated on 11 Feb 2026, reflecting a reassessment of the stock’s outlook. However, all fundamentals, returns, and financial metrics discussed here are current as of 31 July 2026, providing investors with the latest perspective on the company’s performance and prospects.
Read full news article Announcements
Board Meeting Intimation for Consideration And Approval Of Unaudited Financials Results (Standalone And Consolidated) Of The Company For The Quarter Ended 30Th June 2026
27-Jul-2026 | Source : BSEUltramarine & Pigments Ltd-has informed BSE that the meeting of the Board of Directors of the Company is scheduled on 07/08/2026 inter alia to consider and approve the Unaudited Financials Results (Standalone And Consolidated) Of The Company For The Quarter ended 30th June 2026
Shareholder Meeting / Postal Ballot-Scrutinizers Report
23-Jul-2026 | Source : BSEOutcome of remote e-voting and e-voting at the 65th Annual General Meeting held on 22nd July 2026
Shareholder Meeting / Postal Ballot-Outcome of AGM
22-Jul-2026 | Source : BSESummary of proceedings of the 65th Annual General Meeting of the Company
Corporate Actions

07 Aug 2026

Ultramarine & Pigments Ltd has declared 300% dividend, ex-date: 14 Jul 26

No Splits history available

No Bonus history available

No Rights history available
Quality key factors
Valuation key factors
Technicals key factors
 Technical Indicator Scale: Bearish, Mildly Bearish, Sideways, Mildly Bullish, Bullish Turned
 Shareholding Snapshot : Jun 2026
Shareholding Compare (%holding)
Non Institution
None
Held by 0 Schemes
Held by 5 FIIs (1.42%)
Thirumalai Chemicals Limited (14.38%)
Shivani Tejas Trivedi (2.32%)
47.9%
Quarterly Results Snapshot (Consolidated) - Mar'26 - YoY

YoY Growth in quarter ended Mar 2026 is 2.02% vs 43.61% in Mar 2025
YoY Growth in quarter ended Mar 2026 is -16.86% vs 56.58% in Mar 2025
Half Yearly Results Snapshot (Consolidated) - Sep'25

Growth in half year ended Sep 2025 is 18.36% vs 16.12% in Sep 2024
Growth in half year ended Sep 2025 is 12.43% vs 4.08% in Sep 2024
Nine Monthly Results Snapshot (Consolidated) - Dec'25
YoY Growth in nine months ended Dec 2025 is 15.22% vs 17.62% in Dec 2024
YoY Growth in nine months ended Dec 2025 is 14.84% vs 24.16% in Dec 2024
Annual Results Snapshot (Consolidated) - Mar'26
YoY Growth in year ended Mar 2026 is 11.52% vs 23.91% in Mar 2025
YoY Growth in year ended Mar 2026 is 7.62% vs 30.30% in Mar 2025
About Ultramarine & Pigments Ltd

Company Coordinates


