
Compare Umiya Tubes with Similar Stocks
Dashboard
Weak Long Term Fundamental Strength with a -8.24% CAGR growth in Net Sales over the last 5 years
- Company's ability to service its debt is weak with a poor EBIT to Interest (avg) ratio of -1.22
- The company has been able to generate a Return on Equity (avg) of 4.22% signifying low profitability per unit of shareholders funds
Positive results in Mar 26
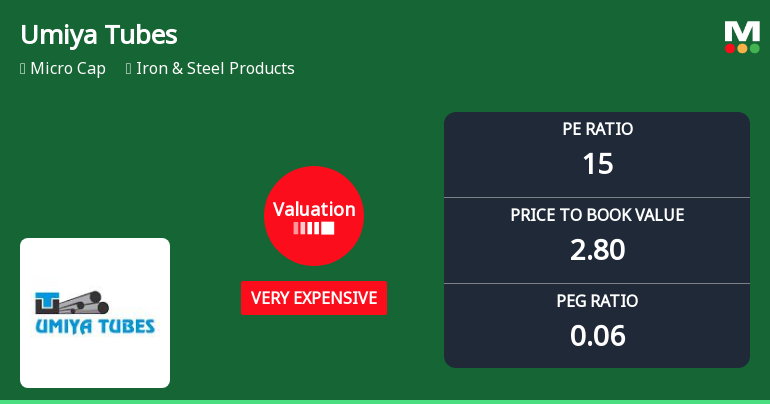
With ROE of 18.7, it has a Very Expensive valuation with a 2.8 Price to Book Value
Reducing Promoter Confidence
Stock DNA
Iron & Steel Products
INR 55 Cr (Micro Cap)
15.00
26
0.00%
-0.01
18.73%
2.80
Total Returns (Price + Dividend) 
Umiya Tubes for the last several years.
Risk Adjusted Returns v/s
Returns Beta

News
Umiya Tubes Ltd Valuation Shifts Signal Price Attractiveness Change Amid Strong Returns
Umiya Tubes Ltd, a micro-cap player in the Iron & Steel Products sector, has witnessed a notable shift in its valuation parameters, moving from an expensive to a very expensive rating. Despite this, the stock has delivered exceptional returns over multiple time horizons, significantly outperforming the Sensex. This article analyses the recent valuation changes, compares key metrics with peers, and assesses the implications for investors.
Read full news articleAre Umiya Tubes Ltd latest results good or bad?
Umiya Tubes Ltd's latest financial results for Q4 FY26 present a complex picture. The company reported a revenue of ₹8.23 crores, marking a significant recovery from previous quarters where sales were negligible or absent. This revenue represents the highest quarterly figure since September 2024, indicating a potential operational restart after a prolonged period of challenges. The net profit for the quarter was ₹1.93 crores, a notable turnaround from a loss of ₹0.19 crores in the prior quarter. Despite these positive indicators, the company's long-term fundamentals raise concerns. The operating profit margin was recorded at 22.60%, which, while healthy in isolation, reflects a contraction from 26.56% in the previous quarter. Additionally, the company's five-year sales growth stands at a negative -21.45%, and it has consistently demonstrated weak return on equity metrics, averaging just 0.62%. The operat...
Read full news article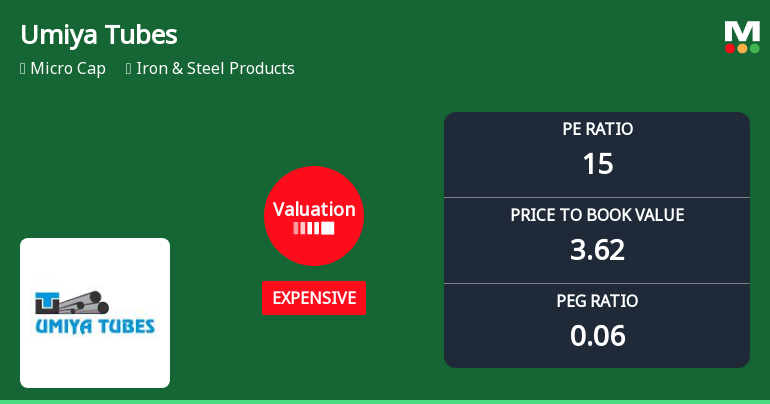
Umiya Tubes Ltd Valuation Shifts Signal Renewed Price Attractiveness Amid Sector Challenges
Umiya Tubes Ltd has witnessed a notable shift in its valuation parameters, moving from a very expensive to an expensive rating, reflecting a recalibration of investor sentiment amid robust price gains and improving fundamentals. This article analyses the recent changes in key valuation metrics such as the price-to-earnings (P/E) and price-to-book value (P/BV) ratios, comparing them with historical averages and peer benchmarks to assess the stock’s price attractiveness.
Read full news article Announcements
Receipt Of Reclassification Request From The Promoter And Promoter Group Members Of The Company.
31-May-2026 | Source : BSECompany has received reclassification request from the Promoter and Promoter Group Members of the Company on 30th May 2026 for their reclassification into Public category.
Board Meeting Outcome for Results - Outcome Of Board Meeting
30-May-2026 | Source : BSEOutcome of Board Meeting - Results for Quarter and Financial year ended on 31st March 2026
Results - March 2026
30-May-2026 | Source : BSEResults March 2026
Corporate Actions

No Upcoming Board Meetings

No Dividend history available

No Splits history available

Umiya Tubes Ltd has announced 1:3 bonus issue, ex-date: 20 Jun 18

No Rights history available
Quality key factors
Valuation key factors
Technicals key factors
 Technical Indicator Scale: Bearish, Mildly Bearish, Sideways, Mildly Bullish, Bullish Turned
 Shareholding Snapshot : Mar 2026
Shareholding Compare (%holding)
Non Institution
None
Held by 0 Schemes
Held by 0 FIIs
None
Kajal Gopal Baldha (8.47%)
87.05%
Quarterly Results Snapshot (Standalone) - Mar'26 - YoY

YoY Growth in quarter ended Mar 2026 is 0.00% vs -100.00% in Mar 2025
YoY Growth in quarter ended Mar 2026 is 310.64% vs 129.56% in Mar 2025
Half Yearly Results Snapshot (Standalone) - Sep'25

Growth in half year ended Sep 2025 is -64.91% vs 26.67% in Sep 2024
Growth in half year ended Sep 2025 is 84.36% vs -37.01% in Sep 2024
Nine Monthly Results Snapshot (Standalone) - Dec'25
YoY Growth in nine months ended Dec 2025 is 694.74% vs 26.67% in Dec 2024
YoY Growth in nine months ended Dec 2025 is 139.73% vs -20.99% in Dec 2024
Annual Results Snapshot (Standalone) - Mar'26
YoY Growth in year ended Mar 2026 is 2,138.60% vs 7.55% in Mar 2025
YoY Growth in year ended Mar 2026 is 261.85% vs 49.12% in Mar 2025
About Umiya Tubes Ltd

Company Coordinates


