
Compare Uni Abex Alloy with Similar Stocks
Stock DNA
Iron & Steel Products
INR 822 Cr (Micro Cap)
19.00
45
0.86%
-0.72
10.71%
1.93
Total Returns (Price + Dividend) 
Latest dividend: 35 per share ex-dividend date: Sep-04-2025
Risk Adjusted Returns v/s
Returns Beta

News
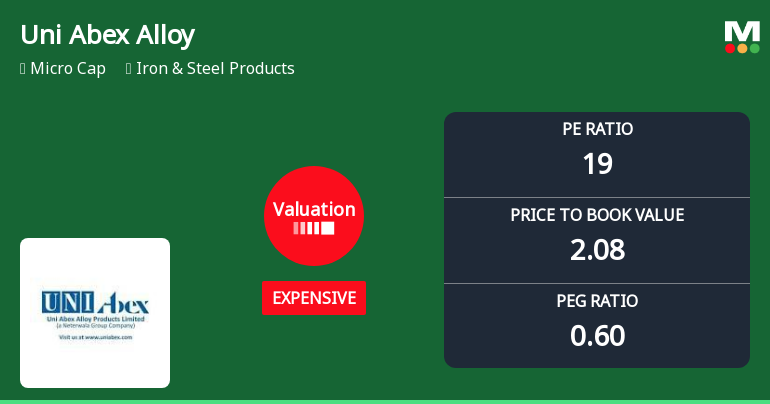
Uni Abex Alloy Products Ltd: Valuation Shift Signals Renewed Price Attractiveness
Uni Abex Alloy Products Ltd has witnessed a notable shift in its valuation parameters, moving from a very expensive to an expensive rating, reflecting a subtle but meaningful improvement in price attractiveness. This change, coupled with robust financial metrics and strong returns relative to the Sensex, positions the micro-cap iron and steel products company as a compelling buy opportunity in a challenging sector.
Read full news article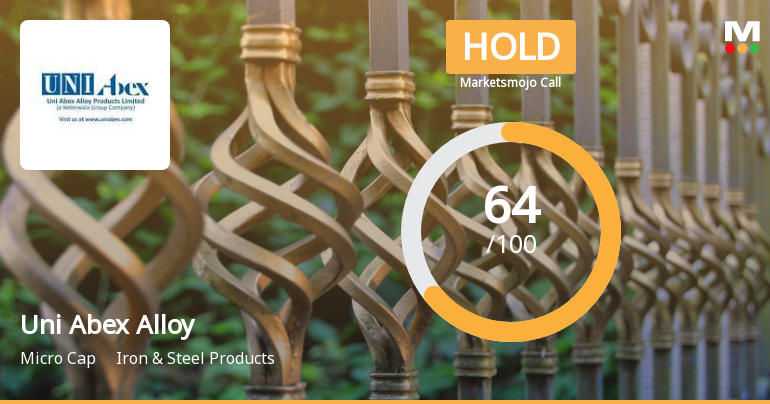
Uni Abex Alloy Products Ltd Downgraded to Hold Amid Valuation Concerns Despite Strong Financials
Uni Abex Alloy Products Ltd, a micro-cap player in the Iron & Steel Products sector, has seen its investment rating downgraded from Buy to Hold as of 3 June 2026. This adjustment follows a comprehensive reassessment of the company’s quality, valuation, financial trend, and technical indicators, reflecting a nuanced outlook despite robust quarterly financial performance and impressive long-term returns.
Read full news article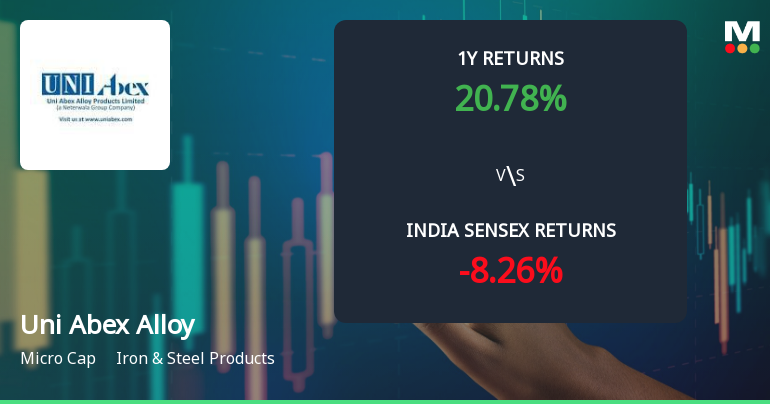
Uni Abex Alloy Products Ltd Sees Technical Momentum Shift Amid Strong Returns
Uni Abex Alloy Products Ltd, a micro-cap player in the Iron & Steel Products sector, has witnessed a notable shift in its technical momentum, reflecting a cautiously optimistic outlook. The stock’s recent upgrade from a Sell to a Buy rating, coupled with robust price returns outperforming the Sensex, signals renewed investor interest and evolving market dynamics.
Read full news article Announcements
Announcement under Regulation 30 (LODR)-Newspaper Publication
05-Jun-2026 | Source : BSEIntimation to the Equity Shareholders of the Company with respect to transfer of equity shares to Investor Education and Protection Fund (IEPF) and Saksham Niveshak Campaign - Regulation 30 of SEBI (Listing Obligation & Disclosure Requirements) Regulations 2015
Intimation To The Equity Shareholders Of The Company With Respect To Transfer Of Equity Shares To Investor Education And Protection Fund (IEPF) And Saksham Niveshak Campaign
04-Jun-2026 | Source : BSEIntimation to the Equity Shareholders of the Company with respect to transfer of equity shares to Investor Education and Protection Fund (IEPF) and Saksham Niveshak Campaign
Announcement under Regulation 30 (LODR)-Newspaper Publication
29-May-2026 | Source : BSENewspaper Advertisement(s) of Audited Financial Results of the Company for FY 2025-26
Corporate Actions

No Upcoming Board Meetings

Uni Abex Alloy Products Ltd has declared 350% dividend, ex-date: 04 Sep 25

No Splits history available

No Bonus history available

No Rights history available
Quality key factors
Valuation key factors
Technicals key factors
 Technical Indicator Scale: Bearish, Mildly Bearish, Sideways, Mildly Bullish, Bullish Turned
 Shareholding Snapshot : Mar 2026
Shareholding Compare (%holding)
Promoters
None
Held by 0 Schemes
Held by 0 FIIs
Unitel Finance And Investments Private Limited (41.39%)
Hitesh Satishchandra Doshi (2.54%)
28.47%
Quarterly Results Snapshot (Standalone) - Mar'26 - QoQ

QoQ Growth in quarter ended Mar 2026 is 71.95% vs -18.38% in Dec 2025
QoQ Growth in quarter ended Mar 2026 is 4,609.87% vs -51.16% in Dec 2025
Half Yearly Results Snapshot (Standalone) - Sep'25
Growth in half year ended Sep 2025 is 4.85% vs -11.41% in Sep 2024
Growth in half year ended Sep 2025 is 7.16% vs -27.49% in Sep 2024
Nine Monthly Results Snapshot (Standalone) - Dec'25
YoY Growth in nine months ended Dec 2025 is 5.92% vs -9.96% in Dec 2024
YoY Growth in nine months ended Dec 2025 is 6.21% vs -34.66% in Dec 2024
Annual Results Snapshot (Standalone) - Mar'26
YoY Growth in year ended Mar 2026 is 13.30% vs 7.28% in Mar 2025
YoY Growth in year ended Mar 2026 is 733.66% vs -5.33% in Mar 2025
About Uni Abex Alloy Products Ltd

Company Coordinates


