
Compare Unichem Labs. with Similar Stocks
Stock DNA
Pharmaceuticals & Biotechnology
INR 3,159 Cr (Small Cap)
45.00
34
0.00%
0.08
2.58%
1.15
Total Returns (Price + Dividend) 
Latest dividend: 4.018148210384809 per share ex-dividend date: Aug-01-2022
Risk Adjusted Returns v/s
Returns Beta

News

Unichem Laboratories Ltd is Rated Sell
Unichem Laboratories Ltd is rated 'Sell' by MarketsMOJO, with this rating last updated on 08 June 2026. However, the analysis and financial metrics discussed here reflect the stock's current position as of 20 June 2026, providing investors with the latest insights into its performance and outlook.
Read full news article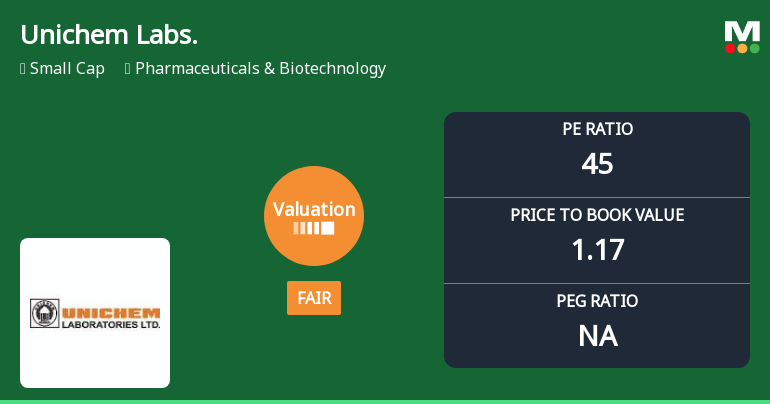
Unichem Laboratories Ltd Valuation Shifts Amidst Sector Comparisons
Unichem Laboratories Ltd has seen a notable shift in its valuation parameters, moving from an attractive to a fair rating as of June 2026. This change reflects evolving market perceptions amid a challenging pharmaceutical sector landscape, with the company’s price-to-earnings (P/E) and price-to-book value (P/BV) ratios now aligning more closely with peer averages. Investors are advised to carefully consider these valuation dynamics alongside the company’s operational metrics and sector trends.
Read full news article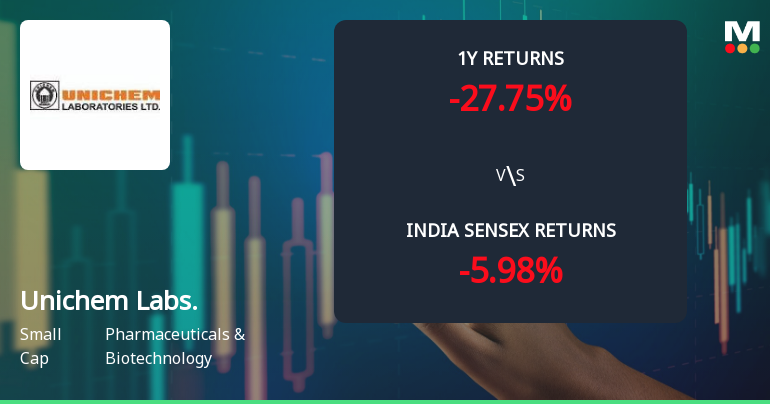
Unichem Laboratories Ltd Technical Momentum Shifts Amid Mixed Market Signals
Unichem Laboratories Ltd has experienced a notable shift in its technical momentum, moving from a sideways trend to a mildly bearish stance. Despite some bullish signals on weekly indicators, monthly technicals suggest caution, reflecting a complex interplay of market forces impacting this small-cap pharmaceutical stock.
Read full news article Announcements
Announcement under Regulation 30 (LODR)-Newspaper Publication
16-Jun-2026 | Source : BSENotice issued in the newspapers on 16th June 2026 in terms of Circular No. 20/2020 5th May 2020 issued by the Ministry of Corporate Affairs.
Disclosures under Reg. 29(2) of SEBI (SAST) Regulations 2011
12-Jun-2026 | Source : BSEThe Exchange has received the disclosure under Regulation 29(2) of SEBI (Substantial Acquisition of Shares & Takeovers) Regulations 2011 for Equity Intelligence India Pvt Ltd
Disclosures under Reg. 29(2) of SEBI (SAST) Regulations 2011
12-Jun-2026 | Source : BSEThe Exchange has received the disclosure under Regulation 29(2) of SEBI (Substantial Acquisition of Shares & Takeovers) Regulations 2011 for Equity Intelligence India Pvt Ltd
Corporate Actions

No Upcoming Board Meetings

Unichem Laboratories Ltd has declared 200% dividend, ex-date: 01 Aug 22

Unichem Laboratories Ltd has announced 2:5 stock split, ex-date: 21 Oct 10

No Bonus history available

No Rights history available
Quality key factors
Valuation key factors
Technicals key factors
 Technical Indicator Scale: Bearish, Mildly Bearish, Sideways, Mildly Bullish, Bullish Turned
 Shareholding Snapshot : Mar 2026
Shareholding Compare (%holding)
Promoters
None
Held by 5 Schemes (9.07%)
Held by 38 FIIs (1.0%)
Ipca Laboratories Limited (52.67%)
Hdfc Small Cap Fund (7.75%)
15.22%
Quarterly Results Snapshot (Consolidated) - Mar'26 - QoQ

QoQ Growth in quarter ended Mar 2026 is 10.35% vs -9.98% in Dec 2025

QoQ Growth in quarter ended Mar 2026 is -95.87% vs 2,322.79% in Dec 2025
Half Yearly Results Snapshot (Consolidated) - Sep'25
Growth in half year ended Sep 2025 is 11.59% vs 18.11% in Sep 2024
Growth in half year ended Sep 2025 is -183.75% vs 206.12% in Sep 2024
Nine Monthly Results Snapshot (Consolidated) - Dec'25
YoY Growth in nine months ended Dec 2025 is 6.76% vs 16.81% in Dec 2024
YoY Growth in nine months ended Dec 2025 is 186.14% vs 75.93% in Dec 2024
Annual Results Snapshot (Consolidated) - Mar'26
YoY Growth in year ended Mar 2026 is 4.31% vs 18.25% in Mar 2025
YoY Growth in year ended Mar 2026 is 83.86% vs 246.67% in Mar 2025
About Unichem Laboratories Ltd

Company Coordinates


