
Compare Union Bank (I) with Similar Stocks
Dashboard
Strong lending practices with low Gross NPA ratio of 2.82%
Strong Long Term Fundamental Strength with a 45.11% CAGR growth in Net Profits
Healthy long term growth as Net profit has grown by an annual rate of 45.11%
Positive results in Mar 26
With ROA of 1.2, it has a Attractive valuation with a 1 Price to Book Value
Total Returns (Price + Dividend) 
Latest dividend: 4.7 per share ex-dividend date: Jul-25-2025
Risk Adjusted Returns v/s
Returns Beta

News
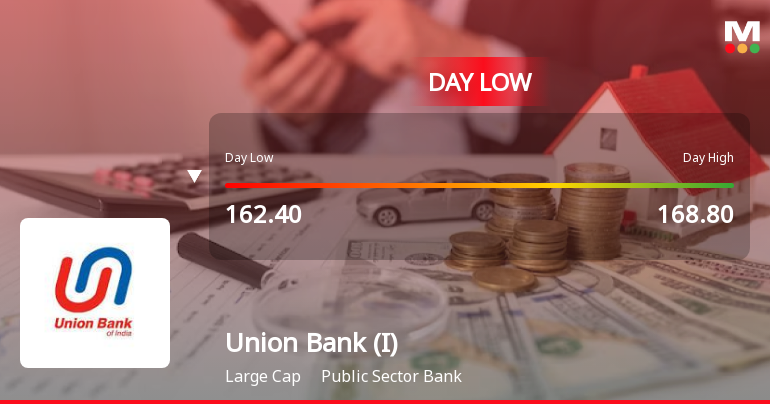
Union Bank of India Hits Intraday Low Amid Price Pressure on 1 June 2026
Union Bank of India experienced a notable intraday decline on 1 June 2026, touching a low of Rs 162.55 as the stock faced significant price pressure amid broader market weakness and sector underperformance.
Read full news article
Union Bank of India is Rated Buy by MarketsMOJO
Union Bank of India is rated 'Buy' by MarketsMOJO, with this rating last updated on 13 March 2026. While the rating was revised on that date, the analysis and financial metrics discussed here reflect the stock’s current position as of 01 June 2026, providing investors with an up-to-date view of the company’s fundamentals, valuation, financial trends, and technical outlook.
Read full news article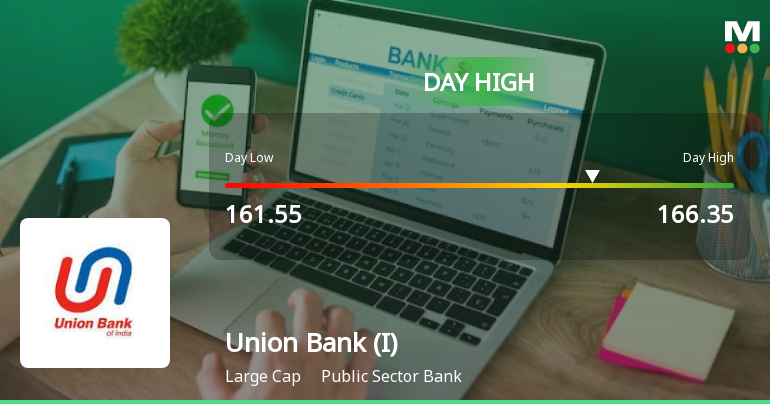
Union Bank of India Rallies 3.33% and Approaches 50 DMA Resistance — A Key Technical Test Ahead
The Sensex climbed 1.25% on 25 May 2026, yet Union Bank of India outpaced the benchmark with a 3.33% gain, touching an intraday high of Rs 166.35. This 2.08-percentage-point outperformance signals a stock-specific momentum shift rather than a mere market tailwind.
Read full news article Announcements
Union Bank of India - Other General Purpose
22-Nov-2019 | Source : NSEUnion Bank of India has submitted to the Exchange a copy of Disclosure of Related Party Transactions pursuant to Regulation 23(9) of SEBI (Listing Obligations & Disclosures) Requirements, 2015
Union Bank of India - Updates
21-Nov-2019 | Source : NSEUnion Bank of India has informed the Exchange regarding 'Disclosure under Regulation 30 of SEBI (LODR) Regulations, 2015'.
Union Bank of India - Press Release
15-Nov-2019 | Source : NSEUnion Bank of India has informed the Exchange regarding a press release dated November 14, 2019, titled "Press Release on the Financial Results for the Quarter / Half year ended on September 30, 2019".
Corporate Actions

No Upcoming Board Meetings

Union Bank of India has declared 47% dividend, ex-date: 25 Jul 25

No Splits history available

No Bonus history available

No Rights history available
Quality key factors
Valuation key factors
Technicals key factors
 Technical Indicator Scale: Bearish, Mildly Bearish, Sideways, Mildly Bullish, Bullish Turned
 Shareholding Snapshot : Mar 2026
Shareholding Compare (%holding)
Promoters
None
Held by 39 Schemes (4.03%)
Held by 714 FIIs (9.37%)
President Of India (74.76%)
Lici Ulip-growth Fund (5.36%)
3.89%
Quarterly Results Snapshot (Standalone) - Mar'26 - QoQ

QoQ Growth in quarter ended Mar 2026 is -0.02% vs 0.97% in Dec 2025
QoQ Growth in quarter ended Mar 2026 is 5.96% vs 18.07% in Dec 2025
Half Yearly Results Snapshot (Standalone) - Sep'25
Growth in half year ended Sep 2025 is 1.64% vs 10.42% in Sep 2024
Growth in half year ended Sep 2025 is -0.40% vs 24.46% in Sep 2024
Nine Monthly Results Snapshot (Standalone) - Dec'25
YoY Growth in nine months ended Dec 2025 is 0.97% vs 8.43% in Dec 2024
YoY Growth in nine months ended Dec 2025 is 2.92% vs 25.77% in Dec 2024
Annual Results Snapshot (Standalone) - Mar'26
YoY Growth in year ended Mar 2026 is 0.08% vs 6.14% in Mar 2025
YoY Growth in year ended Mar 2026 is 3.95% vs 31.79% in Mar 2025
About Union Bank of India

Company Coordinates


