
Compare Uniroyal Ind with Similar Stocks
Dashboard
Weak Long Term Fundamental Strength with a -23.62% CAGR growth in Operating Profits over the last 5 years
- Low ability to service debt as the company has a high Debt to EBITDA ratio of 7.57 times
- The company has been able to generate a Return on Equity (avg) of 3.56% signifying low profitability per unit of shareholders funds
Flat results in Mar 26
Stock DNA
Garments & Apparels
INR 16 Cr (Micro Cap)
NA (Loss Making)
52
0.00%
0.70
-3.63%
0.84
Total Returns (Price + Dividend) 
Uniroyal Ind for the last several years.
Risk Adjusted Returns v/s
Returns Beta

News

Uniroyal Industries Downgraded to Strong Sell Amid Technical and Financial Concerns
Uniroyal Industries Ltd, a micro-cap player in the Garments & Apparels sector, has seen its investment rating downgraded from Sell to Strong Sell as of 8 June 2026. This shift reflects deteriorating technical indicators, flat financial performance, and a cautious valuation outlook despite some long-term growth achievements. The downgrade highlights growing concerns over the company’s ability to sustain profitability and market momentum in a challenging textile industry environment.
Read full news article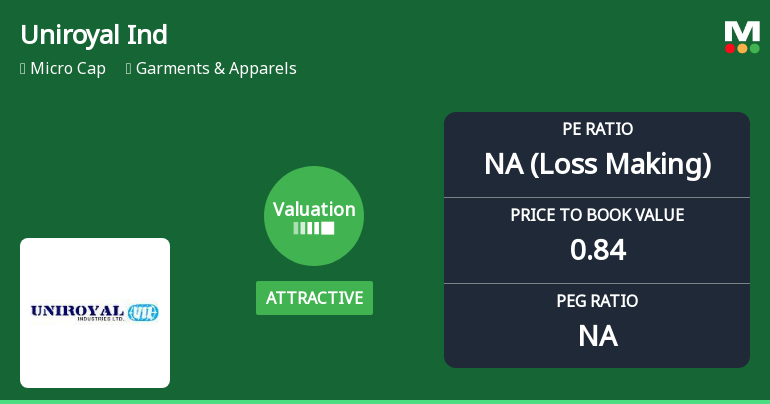
Uniroyal Industries Ltd Valuation Shifts Signal Changing Market Sentiment
Uniroyal Industries Ltd, a micro-cap player in the Garments & Apparels sector, has witnessed a notable shift in its valuation parameters, moving from a very attractive to an attractive rating despite a recent sharp decline in share price. This article analyses the evolving price attractiveness of the stock in the context of its financial metrics, peer comparisons, and broader market trends.
Read full news article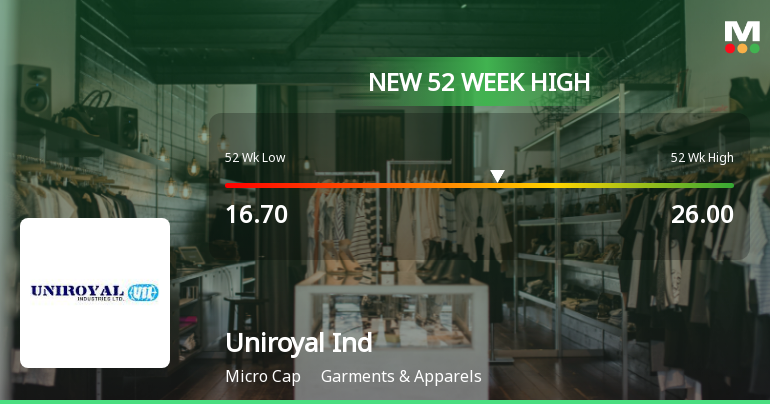
Broad-Based Technical Strength Lifts Uniroyal Industries Ltd to 52-Week High of Rs 26
With a decisive intraday surge pushing Uniroyal Industries Ltd to a new 52-week high of Rs 26 on 2 Jun 2026, the stock has demonstrated remarkable momentum despite a broadly subdued market backdrop.
Read full news article Announcements
Announcement under Regulation 30 (LODR)-Newspaper Publication
30-May-2026 | Source : BSEPublication is attached
Results For The Year Ended 31.03.2026 Styandalone & Consolidated
29-May-2026 | Source : BSEAbove Subject results are attached herewith
Board Meeting Outcome for Audited Results 31.03.2026 Standalone & Consolidated
29-May-2026 | Source : BSEAudited Results Standalone & Consolidated for the year ended 31.03.2026 are approved by the Board of Directors
Corporate Actions

No Upcoming Board Meetings

No Dividend history available

No Splits history available

No Bonus history available

No Rights history available
Quality key factors
Valuation key factors
Technicals key factors
 Technical Indicator Scale: Bearish, Mildly Bearish, Sideways, Mildly Bullish, Bullish Turned
 Shareholding Snapshot : Mar 2026
Shareholding Compare (%holding)
Promoters
None
Held by 2 Schemes (0.05%)
Held by 0 FIIs
Akhil Mahajan (52.27%)
Raj Kumar Lohia (1.21%)
37.58%
Quarterly Results Snapshot (Consolidated) - Mar'26 - QoQ

QoQ Growth in quarter ended Mar 2026 is 0.53% vs -4.17% in Dec 2025

QoQ Growth in quarter ended Mar 2026 is -153.85% vs 657.14% in Dec 2025
Half Yearly Results Snapshot (Consolidated) - Sep'25
Growth in half year ended Sep 2025 is -7.86% vs 18.52% in Sep 2024
Growth in half year ended Sep 2025 is -833.33% vs 109.76% in Sep 2024
Nine Monthly Results Snapshot (Consolidated) - Dec'25
YoY Growth in nine months ended Dec 2025 is -2.97% vs 15.24% in Dec 2024
YoY Growth in nine months ended Dec 2025 is -296.00% vs -16.67% in Dec 2024
Annual Results Snapshot (Consolidated) - Mar'26
YoY Growth in year ended Mar 2026 is -2.51% vs 15.81% in Mar 2025
YoY Growth in year ended Mar 2026 is -252.17% vs -46.51% in Mar 2025
About Uniroyal Industries Ltd

Company Coordinates


