
Compare Unitech Internat with Similar Stocks
Dashboard
Weak Long Term Fundamental Strength as the company has not declared results in the last 6 months
- Low ability to service debt as the company has a high Debt to EBITDA ratio of -27.84 times
- The company has been able to generate a Return on Equity (avg) of 0.90% signifying low profitability per unit of shareholders funds
Flat results in Mar 25
Risky - No result in last 6 months
Consistent Underperformance against the benchmark over the last 3 years
Stock DNA
Specialty Chemicals
INR 3 Cr (Micro Cap)
NA (Loss Making)
15
0.00%
-0.97
91.44%
-0.13
Total Returns (Price + Dividend) 
Unitech Internat for the last several years.
Risk Adjusted Returns v/s
Returns Beta

News

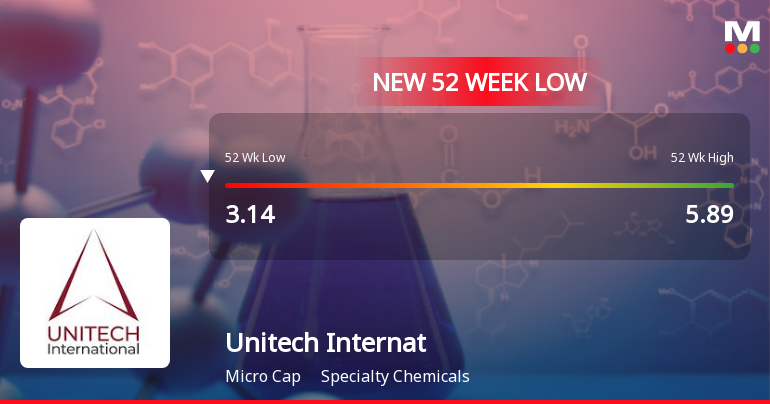
Five Consecutive Losses Push Unitech International Ltd to a New 52-Week Low
For the fifth consecutive session, Unitech International Ltd has closed lower, slipping to a fresh 52-week low of Rs 3.04 on 1 Apr 2026. This marks a 48.4% decline from its 52-week high of Rs 5.89, underscoring sustained selling pressure despite a broadly positive market backdrop.
Read full news article Announcements
Corporate Insolvency Resolution Process (CIRP)-Intimation of meeting of Committee of Creditors
27-May-2026 | Source : BSEDisclosure in pursuance of regulation 30 of the SEBI (LODR) Regulation 2015 read with subclause 16(g) of clause A of Part A of schedule III this is to inform you that 10th meeting of Committee of Creditors of Unitech International Limited was scheduled on 22.05.2026 Friday at 12:00 PM through video conferencing.
Corporate Insolvency Resolution Process (CIRP)-Outcome of meeting of Committee of Creditors
08-May-2026 | Source : BSEDisclosure in pursuance of regulation 30 of SEBI (LODR) Regulations 2015 read with sub-clause 16(g) of clause A of part A of schedule 3 for the outcome of the 9th meeting of the Committee of Creditors of Unitech International Limited held on Tuesday 05th May 2026 at 1:00 PM through Video Conferencing.
Corporate Insolvency Resolution Process (CIRP)-Intimation of meeting of Committee of Creditors
08-May-2026 | Source : BSEDisclosure under regulation 30 of the SEBI (LODR) Regulations 2015 read with part A Schedule 3 we would like you to inform that 9th meeting of committee of creditors of Unitech international Limited was schedule on 5th May 2026 Tuesday at 11 A.M. Through Video conferencing. this is for your information and record.
Corporate Actions

No Upcoming Board Meetings

No Dividend history available

No Splits history available

No Bonus history available

No Rights history available
Quality key factors
Valuation key factors
Technicals key factors
 Technical Indicator Scale: Bearish, Mildly Bearish, Sideways, Mildly Bullish, Bullish Turned
 Shareholding Snapshot : Mar 2025
Shareholding Compare (%holding)
Non Institution
None
Held by 0 Schemes
Held by 0 FIIs
Desai Dhruv Rajesh (24.08%)
Harshil Mayurbhai Shah (4.64%)
60.92%
Quarterly Results Snapshot (Standalone) - Mar'25 - QoQ
QoQ Growth in quarter ended Mar 2025 is 0.00% vs 0.00% in Dec 2024

QoQ Growth in quarter ended Mar 2025 is 61.36% vs -109.52% in Dec 2024
Half Yearly Results Snapshot (Standalone) - Sep'24

Growth in half year ended Sep 2024 is -99.79% vs -63.57% in Sep 2023
Growth in half year ended Sep 2024 is 42.51% vs -20.14% in Sep 2023
Nine Monthly Results Snapshot (Standalone) - Dec'24
YoY Growth in nine months ended Dec 2024 is -99.81% vs -70.19% in Dec 2023
YoY Growth in nine months ended Dec 2024 is 23.01% vs 12.77% in Dec 2023
Annual Results Snapshot (Standalone) - Mar'25
YoY Growth in year ended Mar 2025 is -99.80% vs -78.26% in Mar 2024
YoY Growth in year ended Mar 2025 is 90.01% vs -88.40% in Mar 2024
About Unitech International Ltd

Company Coordinates


