
Compare United Foodbrand with Similar Stocks
Dashboard
Weak Long Term Fundamental Strength with an average Return on Capital Employed (ROCE) of 3.31%
- Poor long term growth as Operating profit has grown by an annual rate 15.32% of over the last 5 years
- Low ability to service debt as the company has a high Debt to EBITDA ratio of 4.59 times
Flat results in Mar 26
With ROCE of 0.3, it has a Expensive valuation with a 3.1 Enterprise value to Capital Employed
Stock DNA
Leisure Services
INR 2,767 Cr (Micro Cap)
NA (Loss Making)
43
0.00%
2.76
-19.06%
8.77
Total Returns (Price + Dividend) 
United Foodbrand for the last several years.
Risk Adjusted Returns v/s
Returns Beta

News
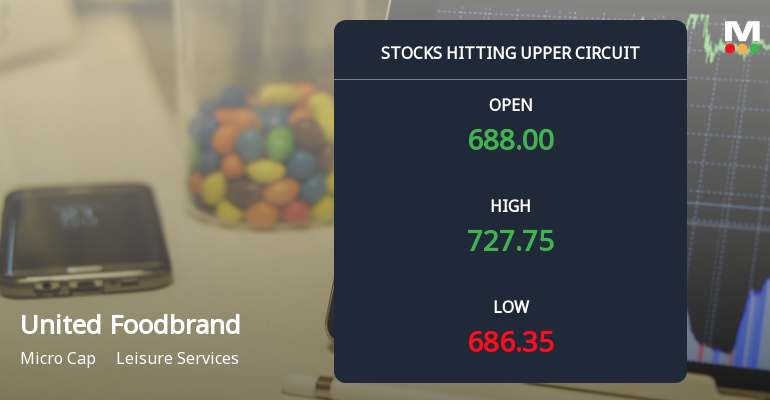
United Foodbrands Ltd Locks at Upper Circuit With 5% Gain — Buyers Queue, Sellers Absent
At Rs 728.15, the buying was done — not because demand dried up, but because the exchange wouldn't let the stock go any higher. United Foodbrands Ltd locked at its upper circuit of 5% on 24 Jun 2026, with buyers queuing and no sellers willing to part with shares.
Read full news article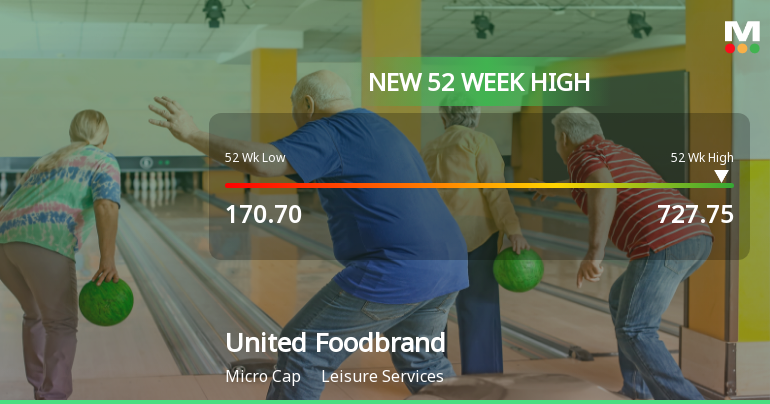
Broad-Based Technical Strength Lifts United Foodbrands Ltd to 52-Week High of Rs 727.75
Surging past its previous peaks, United Foodbrands Ltd touched a new 52-week high of Rs 727.75 on 24 Jun 2026, marking a remarkable rally from its 52-week low of Rs 170.7. This breakout is underpinned by a confluence of bullish technical indicators and sustained price momentum, setting the stage for a noteworthy milestone in the stock’s year-long performance.
Read full news article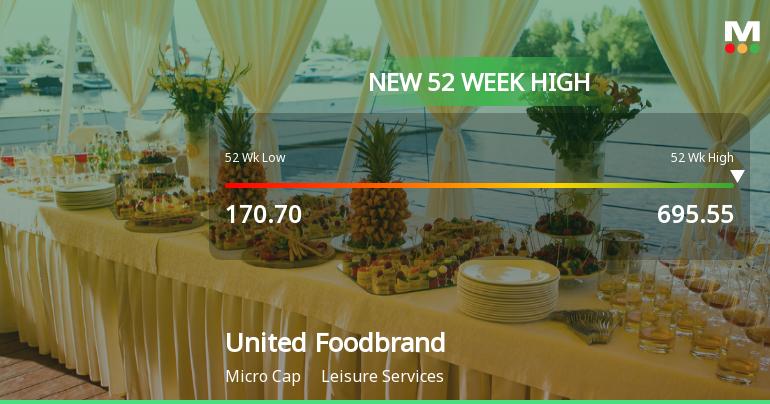
Broad-Based Technical Strength Lifts United Foodbrands Ltd to 52-Week High of Rs 695.55
Surging past its previous peaks, United Foodbrands Ltd touched a new 52-week high of Rs 695.55 on 23 Jun 2026, marking a remarkable rally of 120.87% over the past year. This milestone comes amid a sustained five-day winning streak, reflecting robust price momentum and a confluence of bullish technical indicators.
Read full news article Announcements
Announcement under Regulation 30 (LODR)-Analyst / Investor Meet - Intimation
16-Jun-2026 | Source : BSEIntimation of schedule of Investors Meet
Disclosure Under Regulation 30 Of SEBI LODR Regulations 2015
16-Jun-2026 | Source : BSEDisclosure under Regulation 30 of SEBI LODR Regulations 2015
Announcement under Regulation 30 (LODR)-Analyst / Investor Meet - Intimation
09-Jun-2026 | Source : BSEIntimation of Schedule of Investors Meet
Corporate Actions

No Upcoming Board Meetings

No Dividend history available

No Splits history available

No Bonus history available

No Rights history available
Quality key factors
Valuation key factors
Technicals key factors
 Technical Indicator Scale: Bearish, Mildly Bearish, Sideways, Mildly Bullish, Bullish Turned
 Shareholding Snapshot : Mar 2026
Shareholding Compare (%holding)
Non Institution
0.6369
Held by 3 Schemes (10.94%)
Held by 13 FIIs (9.67%)
Sayaji Housekeeping Services Limited (29.69%)
Jubilant Foodworks Ltd (9.34%)
24.39%
Quarterly Results Snapshot (Consolidated) - Mar'26 - QoQ

QoQ Growth in quarter ended Mar 2026 is -4.29% vs 23.56% in Dec 2025
QoQ Growth in quarter ended Mar 2026 is -88.87% vs 68.05% in Dec 2025
Half Yearly Results Snapshot (Consolidated) - Sep'25

Growth in half year ended Sep 2025 is -1.58% vs -2.27% in Sep 2024
Growth in half year ended Sep 2025 is -219.78% vs 27.58% in Sep 2024
Nine Monthly Results Snapshot (Consolidated) - Dec'25
YoY Growth in nine months ended Dec 2025 is 4.05% vs -1.69% in Dec 2024
YoY Growth in nine months ended Dec 2025 is -505.70% vs 38.82% in Dec 2024
Annual Results Snapshot (Consolidated) - Mar'26
YoY Growth in year ended Mar 2026 is 8.57% vs -1.71% in Mar 2025
YoY Growth in year ended Mar 2026 is -112.77% vs -107.23% in Mar 2025
About United Foodbrands Ltd

Company Coordinates


