
Compare United Homes Group, Inc. with Similar Stocks
Dashboard
With a fall in Operating Profit of -14.31%, the company declared Very Negative results in Jun 25
- The company has declared negative results for the last 9 consecutive quarters
- The company has declared negative results in Mar 23 after 4 consecutive negative quarters
- NET PROFIT(Q) At USD -0.04 MM has Fallen at -104.92%
- INVENTORY TURNOVER RATIO(HY) Lowest at 2.19 times
Risky - Market Cap of less than 100 cr
Consistent Underperformance against the benchmark over the last 3 years
Total Returns (Price + Dividend) 
United Homes Group, Inc. for the last several years.
Risk Adjusted Returns v/s
News
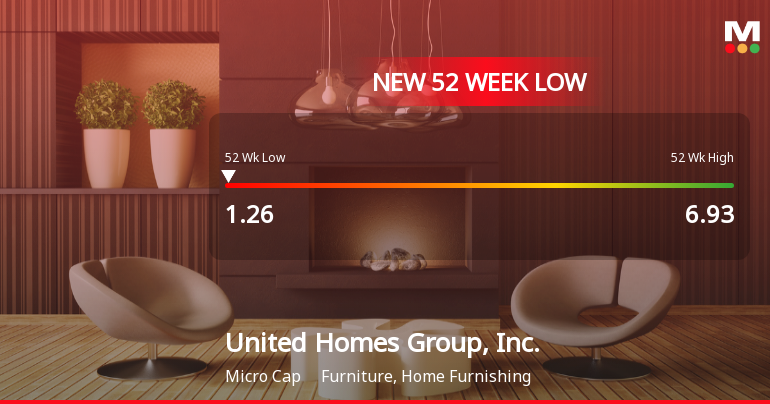
United Homes Group Hits New 52-Week Low at $1.26 Amid Ongoing Struggles
United Homes Group, Inc. has reached a new 52-week low, reflecting a substantial decline in stock performance over the past year. The company has reported negative results for nine consecutive quarters, with a low inventory turnover ratio and a modest return on equity, while maintaining a manageable debt level.
Read full news article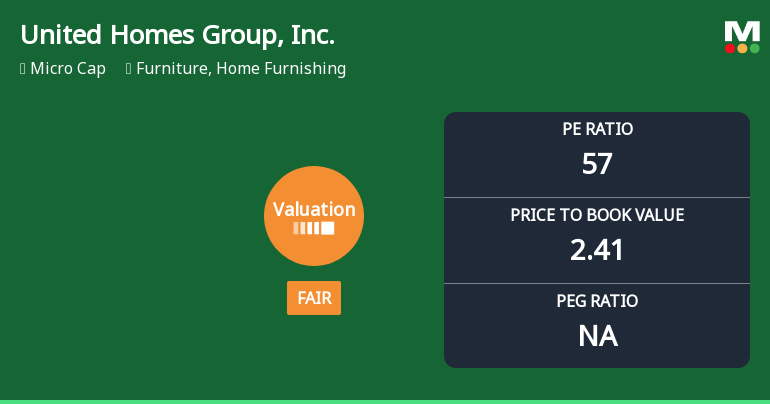
United Homes Group, Inc. Experiences Revision in Its Stock Evaluation Amid Market Challenges
United Homes Group, Inc., a microcap in the furniture sector, has experienced a valuation adjustment, with financial metrics indicating a high P/E ratio and lower returns on capital and equity compared to peers. The company has also faced significant stock performance declines over the past year.
Read full news article Announcements

Corporate Actions
Quality key factors
Valuation key factors
Technicals key factors
 Technical Indicator Scale: Bearish, Mildly Bearish, Sideways, Mildly Bullish, Bullish Turned
 Shareholding Snapshot : Sep 2025
Shareholding Compare (%holding)
Domestic Funds
Held in 13 Schemes (6.71%)
Held by 13 Foreign Institutions (1.58%)
Quarterly Results Snapshot (Consolidated) - Jun'25 - QoQ

QoQ Growth in quarter ended Jun 2025 is 21.26% vs -35.46% in Mar 2025

QoQ Growth in quarter ended Jun 2025 is -134.62% vs 2,500.00% in Mar 2025
Annual Results Snapshot (Consolidated) - Dec'24
YoY Growth in year ended Dec 2024 is 10.01% vs -11.64% in Dec 2023
YoY Growth in year ended Dec 2024 is -62.51% vs 80.00% in Dec 2023
About United Homes Group, Inc.

Company Coordinates


