
Compare United Leasing with Similar Stocks
Total Returns (Price + Dividend) 
United Leasing for the last several years.
Risk Adjusted Returns v/s
Returns Beta

News
When is the next results date for United Leasing & Industries Ltd.?
The next results date for United Leasing & Industries Ltd. is scheduled for 27 May 2026....
Read full news article
United Leasing & Industries Downgraded to Strong Sell Amid Technical and Valuation Concerns
United Leasing & Industries Ltd., a micro-cap player in the Garments & Apparels sector, has seen its investment rating downgraded from Sell to Strong Sell as of 28 Apr 2026. This revision reflects a confluence of deteriorating technical indicators, expensive valuation metrics, weak financial trends, and subpar quality scores, signalling caution for investors amid ongoing market challenges.
Read full news article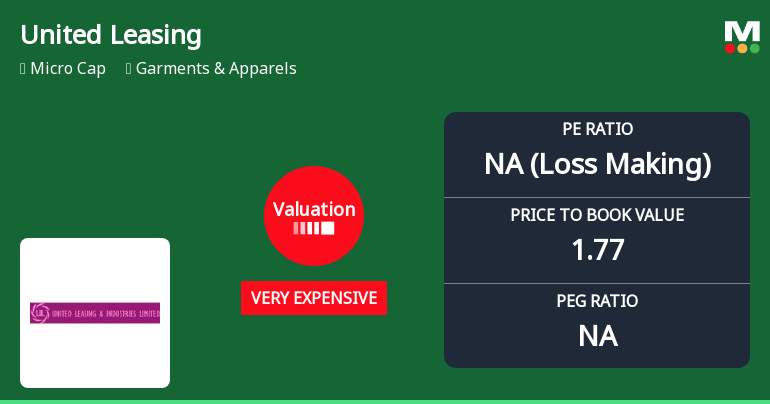
United Leasing & Industries Ltd: Valuation Shifts Signal Elevated Price Risk
United Leasing & Industries Ltd has seen a marked deterioration in its valuation parameters, with its price-to-earnings (P/E) ratio plunging to an unprecedented negative level and its price-to-book value (P/BV) ratio rising to 1.77, signalling a shift from risky to very expensive territory. This change, coupled with weak profitability metrics and a recent downgrade in its Mojo Grade to Sell, raises concerns about the stock’s price attractiveness relative to its historical and peer benchmarks.
Read full news article Announcements
Board Meeting Intimation for Prior Intimation Of Board Meeting
23-May-2026 | Source : BSEUnited Leasing & Industries Ltdhas informed BSE that the meeting of the Board of Directors of the Company is scheduled on 27/05/2026 inter alia to consider and approve Please Find Enclosed the Prior Intimation of Board Meeting
Non-Applicability Of Annual Secretarial Compliance Report For The Year Ended 31St March 2026 Under Regulation 24A Of The SEBI (Listing Obligations And Disclosure Requirements) Regulations 2015
30-Apr-2026 | Source : BSEPlease Find Enclosed Non Applicability of Regulation 24A of the SEBI (LODR) 2015 for the year ended 31st March 2026.
Non-Applicability Of Disclosure Of Large Corporate For The Year Ended 31St March 2026
30-Apr-2026 | Source : BSEPlease Find Enclosed the Non Applicability of Disclosure of Large Corporate for the year 31st March 2026.
Corporate Actions

No Upcoming Board Meetings

No Dividend history available

No Splits history available

No Bonus history available

No Rights history available
Quality key factors
Valuation key factors
Technicals key factors
 Technical Indicator Scale: Bearish, Mildly Bearish, Sideways, Mildly Bullish, Bullish Turned
 Shareholding Snapshot : Mar 2026
Shareholding Compare (%holding)
Non Institution
None
Held by 0 Schemes
Held by 0 FIIs
Aditya Khanna (16.58%)
None
54.15%
Quarterly Results Snapshot (Standalone) - Mar'26 - QoQ

QoQ Growth in quarter ended Mar 2026 is -47.91% vs 53.80% in Dec 2025
QoQ Growth in quarter ended Mar 2026 is -108.33% vs 250.00% in Dec 2025
Half Yearly Results Snapshot (Standalone) - Sep'25
Growth in half year ended Sep 2025 is -3.68% vs 16.01% in Sep 2024
Growth in half year ended Sep 2025 is -132.00% vs 31.58% in Sep 2024
Nine Monthly Results Snapshot (Standalone) - Dec'25
YoY Growth in nine months ended Dec 2025 is 3.78% vs 5.90% in Dec 2024
YoY Growth in nine months ended Dec 2025 is -86.67% vs -9.09% in Dec 2024
Annual Results Snapshot (Standalone) - Mar'26
YoY Growth in year ended Mar 2026 is -9.04% vs 9.03% in Mar 2025
YoY Growth in year ended Mar 2026 is -72.73% vs 37.50% in Mar 2025
About United Leasing & Industries Ltd.

Company Coordinates


