
Compare Universal Starch with Similar Stocks
Dashboard
Weak Long Term Fundamental Strength with a 12.99% CAGR growth in Operating Profits over the last 5 years
- Low ability to service debt as the company has a high Debt to EBITDA ratio of 3.56 times
With a growth in Net Profit of 83.78%, the company declared Very Positive results in Mar 26
With ROCE of 9.4, it has a Very Attractive valuation with a 1.1 Enterprise value to Capital Employed
Majority shareholders : Promoters
Market Beating performance in long term as well as near term
Stock DNA
Other Agricultural Products
INR 88 Cr (Micro Cap)
7.00
45
0.00%
0.84
18.80%
1.26
Total Returns (Price + Dividend) 
Latest dividend: 1.0000 per share ex-dividend date: Sep-16-2011
Risk Adjusted Returns v/s
Returns Beta

News

Universal Starch Chem Allied Ltd is Rated Hold
Universal Starch Chem Allied Ltd is rated 'Hold' by MarketsMOJO, with this rating last updated on 26 May 2026. However, the analysis and financial metrics discussed here reflect the stock's current position as of 28 June 2026, providing investors with an up-to-date view of the company’s fundamentals, returns, and market performance.
Read full news article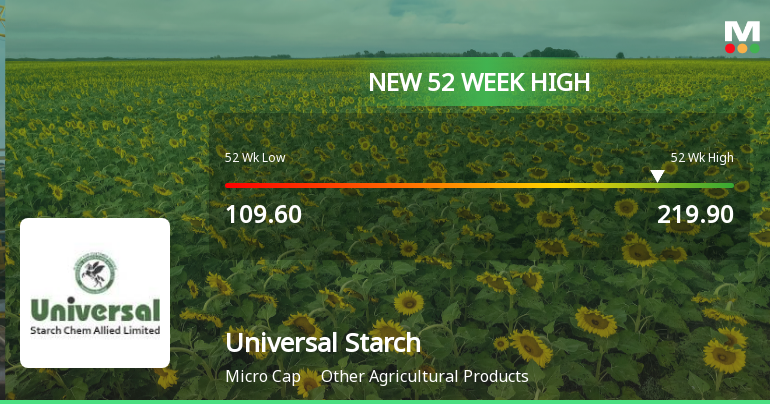
Broad-Based Technical Strength Lifts Universal Starch Chem Allied Ltd to 52-Week High of Rs 219.9
Surging to a new 52-week high of Rs 219.9 on 22 Jun 2026, Universal Starch Chem Allied Ltd has demonstrated remarkable price momentum, outperforming its sector and the broader market with a 31.79% gain over the past year against the Sensex's 6.42% decline.
Read full news article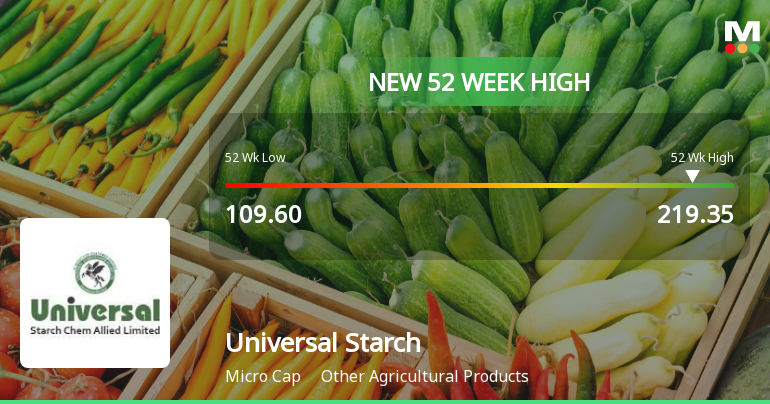
Broad-Based Technical Strength Lifts Universal Starch Chem Allied Ltd to 52-Week High of Rs 219.35
Surging past its previous peak, Universal Starch Chem Allied Ltd touched a fresh 52-week high of Rs 219.35 on 17 Jun 2026, marking a significant milestone in its price momentum. This advance comes amid a backdrop of strong technical signals and a market environment where the broader indices are also showing resilience.
Read full news article Announcements
Compliances-Reg.24(A)-Annual Secretarial Compliance
29-May-2026 | Source : BSEASCR Report 31.03.2026
Announcement under Regulation 30 (LODR)-Change in Management
28-May-2026 | Source : BSERE-APPOINTMENT OF INTERNAL AUDITOR
Announcement under Regulation 30 (LODR)-Newspaper Publication
28-May-2026 | Source : BSENEWSPAPER PUBLICATION FOR FINANCIAL RESULT FOR QUARTER AND YEAR ENDED 31.03.2026
Corporate Actions

No Upcoming Board Meetings

Universal Starch Chem Allied Ltd has declared 10% dividend, ex-date: 16 Sep 11

No Splits history available

No Bonus history available

No Rights history available
Quality key factors
Valuation key factors
Technicals key factors
 Technical Indicator Scale: Bearish, Mildly Bearish, Sideways, Mildly Bullish, Bullish Turned
 Shareholding Snapshot : Mar 2026
Shareholding Compare (%holding)
Promoters
None
Held by 0 Schemes
Held by 0 FIIs
Jitendrasinh J Rawal (14.18%)
Om Chamunda Maa Trading Pvt Ltd (10.92%)
25.37%
Quarterly Results Snapshot (Standalone) - Mar'26 - QoQ

QoQ Growth in quarter ended Mar 2026 is 29.48% vs 21.13% in Dec 2025

QoQ Growth in quarter ended Mar 2026 is 83.78% vs 589.47% in Dec 2025
Half Yearly Results Snapshot (Standalone) - Sep'25
Growth in half year ended Sep 2025 is -2.51% vs -12.36% in Sep 2024
Growth in half year ended Sep 2025 is 74.22% vs -233.66% in Sep 2024
Nine Monthly Results Snapshot (Standalone) - Dec'25
YoY Growth in nine months ended Dec 2025 is -4.68% vs -7.67% in Dec 2024
YoY Growth in nine months ended Dec 2025 is 1,196.30% vs -93.37% in Dec 2024
Annual Results Snapshot (Standalone) - Mar'26
YoY Growth in year ended Mar 2026 is -0.47% vs -6.87% in Mar 2025
YoY Growth in year ended Mar 2026 is 308.72% vs -54.08% in Mar 2025
About Universal Starch Chem Allied Ltd

Company Coordinates


