
Compare Updater Services with Similar Stocks
Stock DNA
Diversified Commercial Services
INR 1,280 Cr (Micro Cap)
13.00
32
0.00%
-0.27
8.65%
1.17
Total Returns (Price + Dividend) 
Updater Services for the last several years.
Risk Adjusted Returns v/s
Returns Beta

News

Updater Services Ltd Technical Momentum Shifts Amid Market Volatility
Updater Services Ltd has experienced a notable shift in its technical momentum, reflecting a complex interplay of bullish and bearish signals across multiple timeframes. Despite a recent downgrade to a Sell rating and a sharp day decline of 5.56%, the stock’s technical indicators reveal a nuanced picture that investors must carefully analyse amid its micro-cap status and sector dynamics.
Read full news article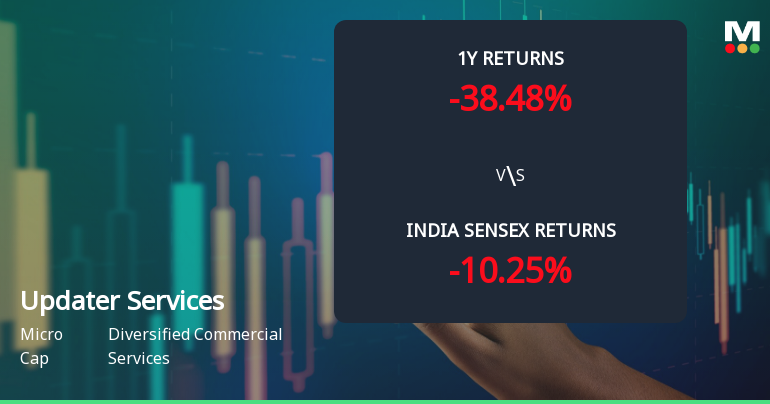
Updater Services Ltd Sees Technical Momentum Shift Amid Mixed Market Returns
Updater Services Ltd has exhibited a notable shift in its technical momentum, moving from a sideways trend to a mildly bullish stance on weekly charts, despite mixed signals from various technical indicators. The stock’s recent price action, combined with evolving momentum indicators such as MACD, RSI, and moving averages, suggests a nuanced outlook for investors navigating this micro-cap player in the diversified commercial services sector.
Read full news article
Updater Services Ltd Downgraded to Sell Amid Mixed Financial and Technical Signals
Updater Services Ltd, a micro-cap player in the diversified commercial services sector, has seen its investment rating downgraded from Hold to Sell as of 3 June 2026. This shift reflects a complex interplay of factors across quality, valuation, financial trends, and technical indicators, signalling caution for investors despite some pockets of operational strength.
Read full news article Announcements
Disclosures under Reg. 29(2) of SEBI (SAST) Regulations 2011
09-Jun-2026 | Source : BSEThe Exchange has received the disclosure under Regulation 29(2) of SEBI (Substantial Acquisition of Shares & Takeovers) Regulations 2011 for Bandhan Mutual Fund
Announcement under Regulation 30 (LODR)-Earnings Call Transcript
04-Jun-2026 | Source : BSEAnnouncement under Regulation 30 (LODR) - Earnings Call Transcript
Announcement Under Regulation 30(9) Of SEBI (LODR) Regulations 2015
02-Jun-2026 | Source : BSEAnnouncement under Regulation 30(9) of SEBI (LODR) Regulations 2015 regarding resignation of Mr. Subinder Jeet Singh Khurana (DIN: 00031710) Independent Director of M/s Denave India Private Limited a material subsidiary of M/s Updater Services Limited.
Corporate Actions

No Upcoming Board Meetings

No Dividend history available

No Splits history available

No Bonus history available

No Rights history available
Quality key factors
Valuation key factors
Technicals key factors
 Technical Indicator Scale: Bearish, Mildly Bearish, Sideways, Mildly Bullish, Bullish Turned
 Shareholding Snapshot : Mar 2026
Shareholding Compare (%holding)
Promoters
None
Held by 2 Schemes (12.16%)
Held by 10 FIIs (4.03%)
Tangirala Raghunandana (24.12%)
Bandhan Small Cap Fund (9.76%)
20.54%
Quarterly Results Snapshot (Consolidated) - Mar'26 - QoQ

QoQ Growth in quarter ended Mar 2026 is -3.17% vs 5.18% in Dec 2025

QoQ Growth in quarter ended Mar 2026 is 206.11% vs -53.95% in Dec 2025
Half Yearly Results Snapshot (Consolidated) - Sep'25
Growth in half year ended Sep 2025 is 7.31% vs 12.62% in Sep 2024
Growth in half year ended Sep 2025 is -9.35% vs 134.15% in Sep 2024
Nine Monthly Results Snapshot (Consolidated) - Dec'25
YoY Growth in nine months ended Dec 2025 is 8.37% vs 11.44% in Dec 2024
YoY Growth in nine months ended Dec 2025 is -31.67% vs 93.18% in Dec 2024
Annual Results Snapshot (Consolidated) - Mar'26
YoY Growth in year ended Mar 2026 is 7.44% vs 11.93% in Mar 2025
YoY Growth in year ended Mar 2026 is -27.88% vs 74.83% in Mar 2025
About Updater Services Ltd

Company Coordinates


